Running an animal shelter efficiently requires tracking multiple key performance indicators (KPIs) such as adoptions, intake, health metrics, and volunteer engagement. The Animal Shelter KPI Dashboard in Google Sheets provides a ready-to-use solution to monitor all shelter operations, track performance, and make data-driven decisions.
This article explains the features, benefits, and best practices for using this dashboard effectively.Animal Shelter KPI Dashboard in Google Sheets
What Is an Animal Shelter KPI Dashboard in Google Sheets?
An Animal Shelter KPI Dashboard is a visual tool built in Google Sheets that consolidates critical metrics related to animal care, adoptions, staff performance, and operational efficiency.Animal Shelter KPI Dashboard in Google Sheets
With this dashboard, shelter managers can:
-
Track MTD (Month-to-Date) and YTD (Year-to-Date) performance
-
Compare actual performance with targets and previous year results
-
Identify trends in adoptions, intakes, and volunteer activity
-
Make informed decisions to improve shelter operations and animal welfare
Key Features of the Animal Shelter KPI Dashboard in Google Sheets
Click to Buy Animal Shelter KPI Dashboard in Google Sheets
This dashboard contains six worksheets, each designed for comprehensive monitoring:Animal Shelter KPI Dashboard in Google Sheets
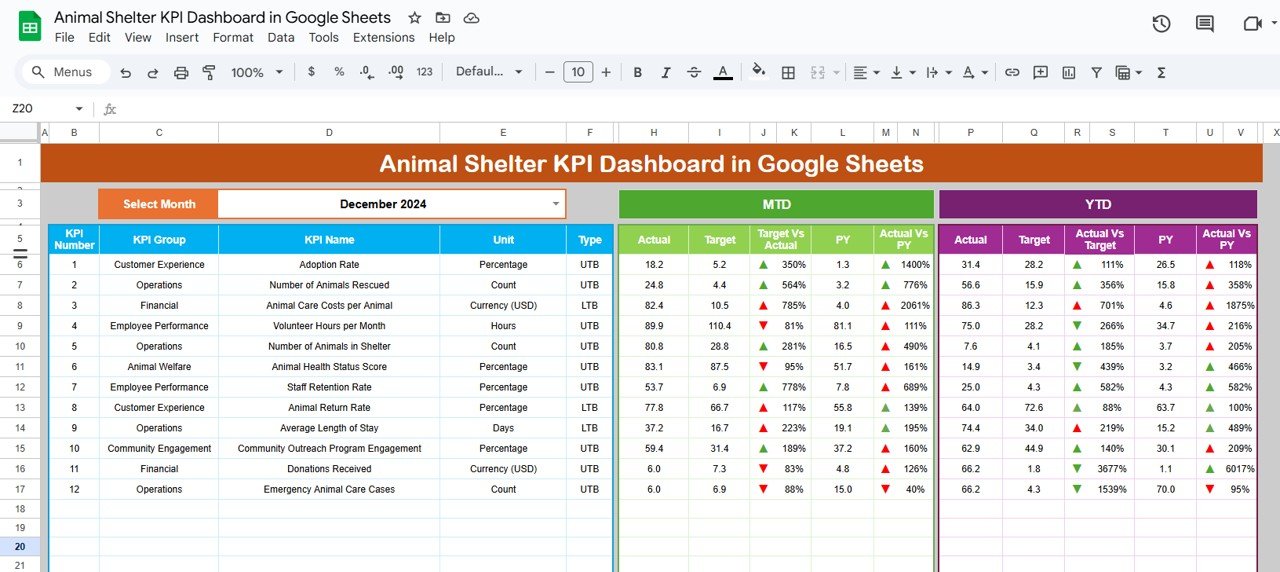
1. Dashboard Sheet Tab
The Dashboard Sheet provides a high-level overview of all KPIs:
-
Month Selection Dropdown (Range D3): Updates all metrics for the selected month
-
MTD Metrics: Actual, target, and previous year data with conditional formatting arrows for quick insights
-
YTD Metrics: Aggregate year-to-date performance metrics with visual indicators
-
Tracks KPIs such as adoptions, intake, medical checkups, and volunteer activity
Click to Buy Animal Shelter KPI Dashboard in Google Sheets
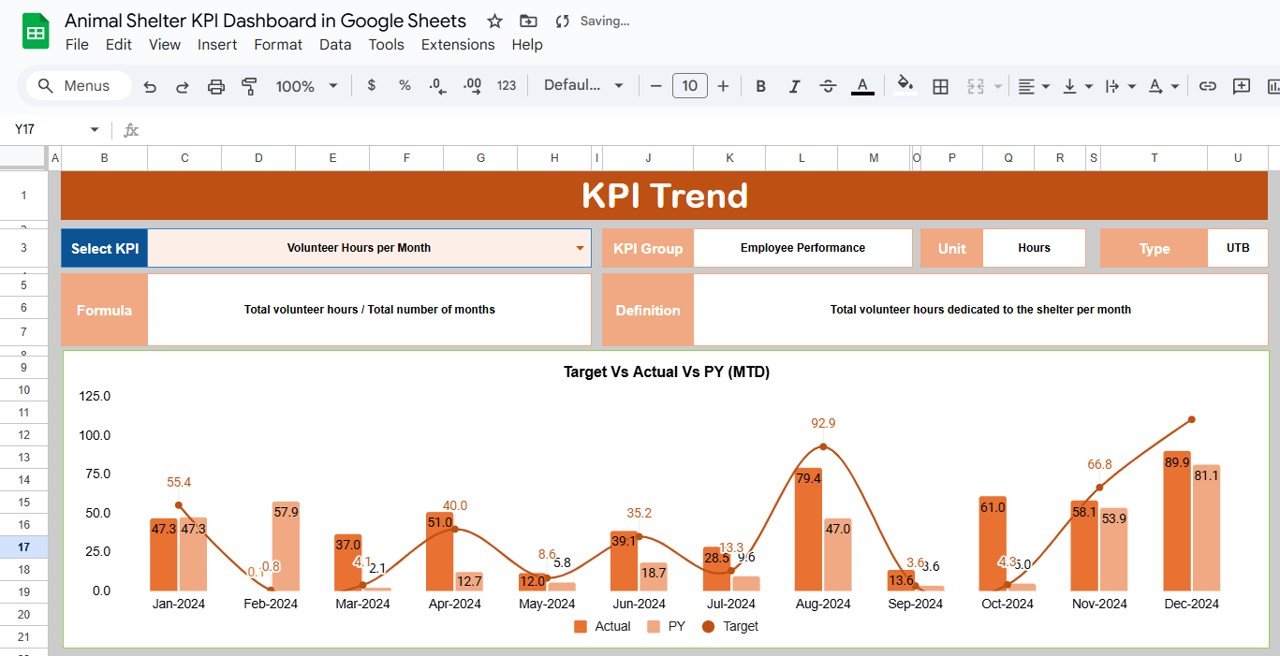
2. KPI Trend Sheet Tab
The KPI Trend Sheet allows detailed analysis of individual KPIs:
-
Select a KPI from the dropdown in Range C3
-
Displays KPI Group, Unit, and Type (Lower-the-Better / Upper-the-Better)
-
Shows KPI formula and definition for reference
-
Provides trend visualization over time to monitor performance improvements or declines
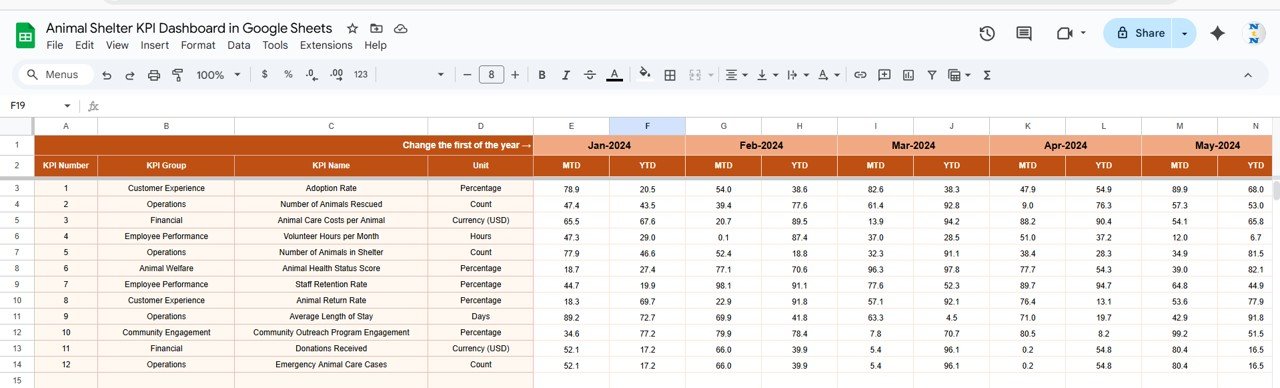
3. Actual Numbers Sheet Tab
-
Enter actual values for each KPI for MTD and YTD
-
Update the first month of the year in Range E1 to adjust calculations
-
Ensures that the dashboard reflects real-time performance accurately
Click to Buy Animal Shelter KPI Dashboard in Google Sheets
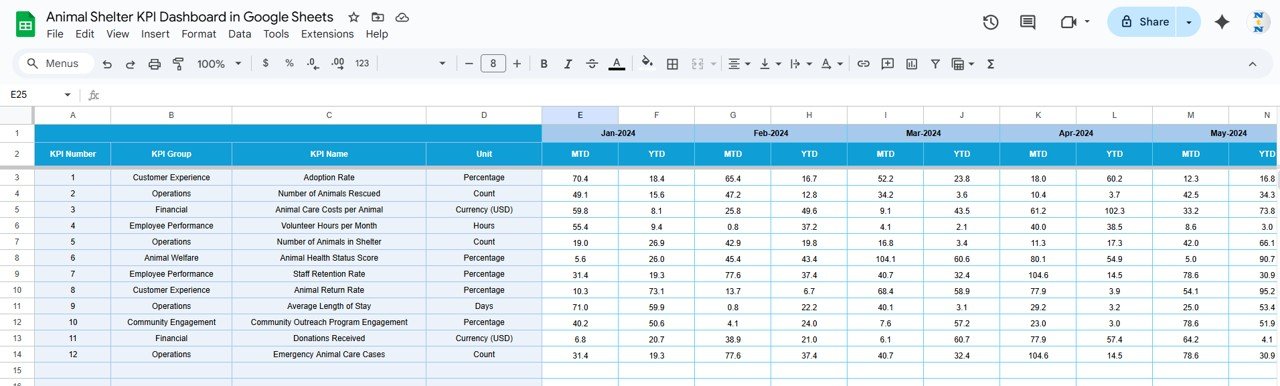
4. Target Sheet Tab
-
Enter target numbers for each KPI for the selected month
-
Supports MTD and YTD comparisons
-
Helps shelter managers evaluate whether goals are being met
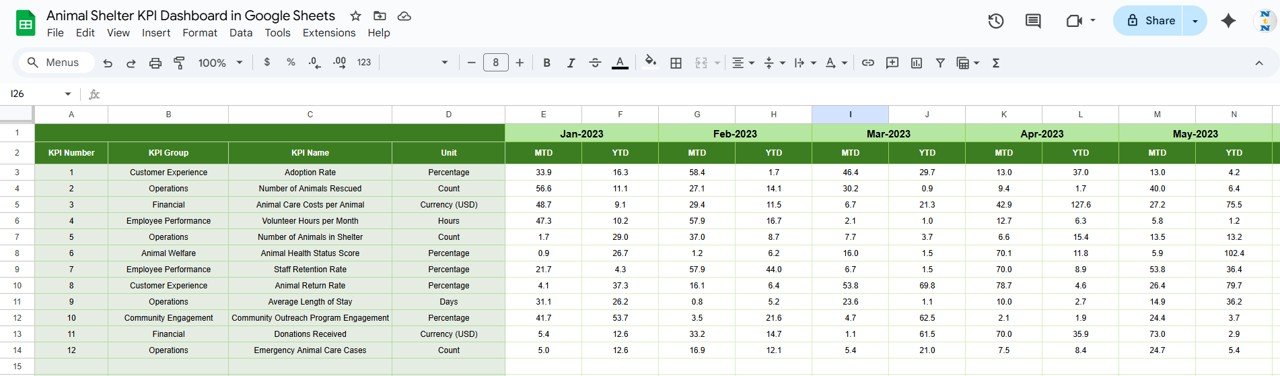
5. Previous Year Numbers Sheet Tab
-
Enter previous year performance metrics
-
Enables year-over-year analysis to identify trends and improvements
-
Useful for tracking seasonal patterns in adoptions or intake
Click to Buy Animal Shelter KPI Dashboard in Google Sheets
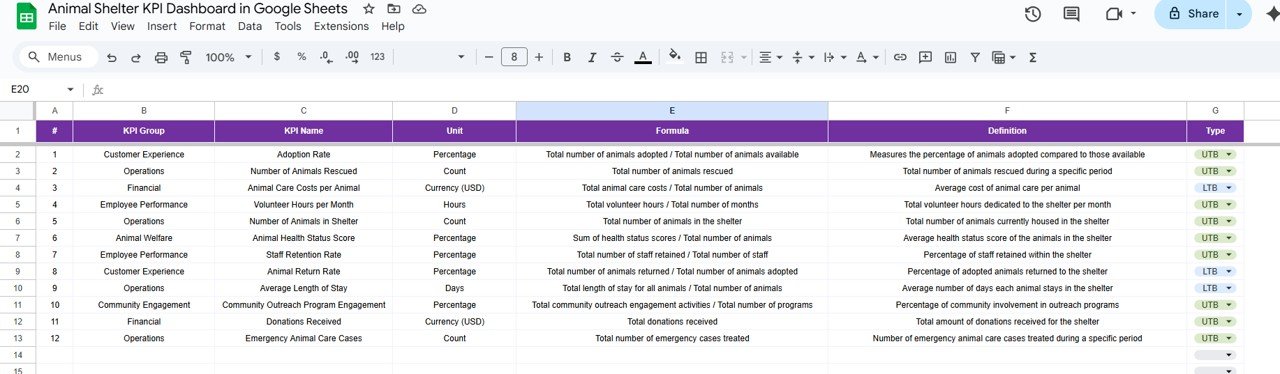
6. KPI Definition Sheet Tab
-
Document KPI Name, Group, Unit, Formula, Definition, and Performance Type
-
Ensures clarity and consistency in measurement across the dashboard
-
Helps new staff and volunteers understand key metrics easily
Examples of KPIs to Track
Some essential KPIs for an animal shelter include:
-
Total Adoptions (Upper-the-Better): Number of animals adopted
-
Intake Count (Upper-the-Better): Number of animals received at the shelter
-
Medical Check Compliance (Upper-the-Better): Percentage of animals with completed health checks
-
Volunteer Hours (Upper-the-Better): Total volunteer hours contributed
-
Return Rate (Lower-the-Better): Number of animals returned after adoption
-
Satisfaction Score (Upper-the-Better): Feedback from adopters and volunteers
Each KPI should include:
-
Unit of Measure (e.g., count, %, hours)
-
Formula (e.g., Adoptions ÷ Total Animals Available)
-
Performance Type (Upper-the-Better / Lower-the-Better)
Advantages of Using the Animal Shelter KPI Dashboard in Google Sheets
Click to Buy Animal Shelter KPI Dashboard in Google Sheets
-
Centralized Data: All shelter performance metrics are in one sheet
-
Real-Time Insights: Update actuals and instantly see dashboard changes
-
Trend Analysis: Compare current performance with previous months and years
-
Identify Gaps: Highlight underperforming areas, such as low adoption rates
-
Data-Driven Decisions: Improve operational efficiency and animal welfare
-
Customizable: Adjust KPIs, formulas, and targets based on shelter priorities
Best Practices for Using the Dashboard
Click to Buy Animal Shelter KPI Dashboard in Google Sheets
-
Update Data Regularly: Input intake, adoptions, and volunteer hours promptly
-
Segment KPIs: Track by animal type, shelter location, or program
-
Monitor Trends: Review monthly and yearly comparisons to identify patterns
-
Focus on Critical KPIs: Prioritize areas impacting animal welfare and adoptions
-
Communicate Metrics: Share dashboards with staff, volunteers, and stakeholders for transparency
How This Dashboard Helps Shelter Managers
-
Optimize Operations: Track adoptions, intakes, and volunteer activity efficiently
-
Improve Animal Welfare: Ensure all animals receive timely medical checks and care
-
Enhance Volunteer Engagement: Monitor volunteer contributions and identify areas for recognition
-
Track Shelter Goals: Measure performance against MTD, YTD, and previous year targets
-
Support Strategic Planning: Use trends and insights to plan campaigns and initiatives
Frequently Asked Questions (FAQs)
Click to Buy Animal Shelter KPI Dashboard in Google Sheets
Q1: Can I add more KPIs to this dashboard?
Yes, the dashboard is fully customizable. You can add KPIs relevant to your shelter, such as foster care metrics or adoption events.
Q2: How often should the data be updated?
Update MTD data monthly and YTD data cumulatively for accurate performance tracking.
Q3: Can I compare performance across multiple shelter locations?
Yes, you can add location-based segmentation in the data and dashboard sheets.
Q4: Is this dashboard suitable for volunteers and staff collaboration?
Absolutely. Google Sheets allows multiple users to view and update the dashboard in real-time.
Q5: Can this dashboard track seasonal trends in adoptions or intake?
Yes, by using MTD, YTD, and previous year data, you can identify seasonal patterns and plan accordingly.
Conclusion
Click to Buy Animal Shelter KPI Dashboard in Google Sheets
The Animal Shelter KPI Dashboard in Google Sheets is an essential tool for monitoring performance, improving operational efficiency, and ensuring animal welfare. With MTD and YTD metrics, trend analysis, and clear KPI definitions, shelter managers can make informed decisions to optimize adoptions, intake, and volunteer engagement.
Visit our YouTube channel to learn step-by-step video tutorials
Youtube.com/@NeotechNavigators
Watch the step-by-step video Demo: