Ensuring product quality is critical in any manufacturing or service process. The Quality Assurance Dashboard in Google Sheets provides a ready-to-use solution to monitor inspection metrics, track defects, and analyze performance across departments. This dashboard helps quality managers, inspectors, and production teams make data-driven decisions and maintain high standards.
In this article, we’ll explore the key features, advantages, best practices, and FAQs of this dashboard.
What Is a Quality Assurance Dashboard?
A Quality Assurance (QA) Dashboard is a visual tool that consolidates quality metrics in a single interface. It tracks KPIs such as total samples tested, defects found, rework time, and inspection duration.
By using Google Sheets, this dashboard allows teams to:
-
Monitor quality metrics in real-time
-
Compare performance by department, inspector, or shift
-
Track trends over time for continuous improvement
-
Make informed decisions to reduce defects and rework
Key Features of the Quality Assurance Dashboard
This dashboard includes three main sheets:
1. Dashboard Sheet Tab
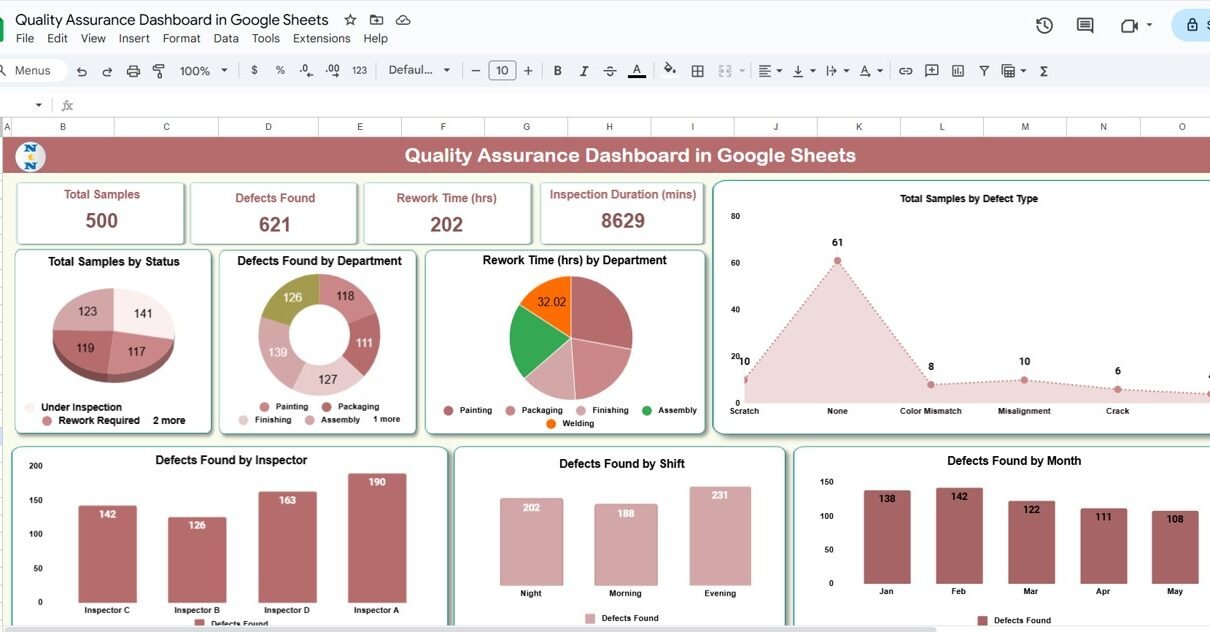
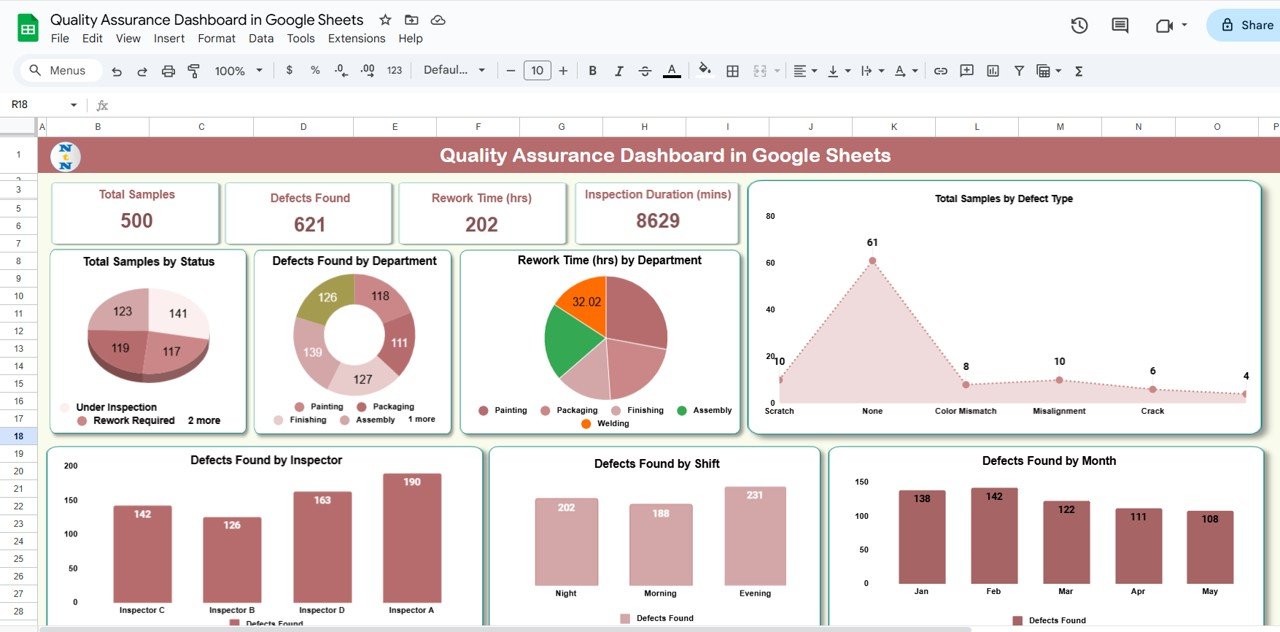
The Dashboard Sheet provides a comprehensive overview of QA performance using cards and charts.
Cards Section:
-
Total Samples: Total number of samples tested
-
Defects Found: Total defects identified across all inspections
-
Rework Time (hrs): Average time spent correcting defects
-
Inspection Duration (mins): Average inspection time per sample
Charts Section:
-
Total Samples by Status: Visualizes samples as completed, pending, or in-progress
-
Defects Found by Department: Shows which departments have the most defects
-
Rework Time by Department: Tracks average rework time by department
-
Total Samples by Defect Type: Categorizes defects by type
-
Defects Found by Month: Displays monthly trends in defect occurrences
-
Defects Found by Shift: Highlights patterns by shift
-
Defects Found by Inspector: Tracks performance and accuracy by inspector
Click to Buy Quality Assurance Dashboard in Google Sheets
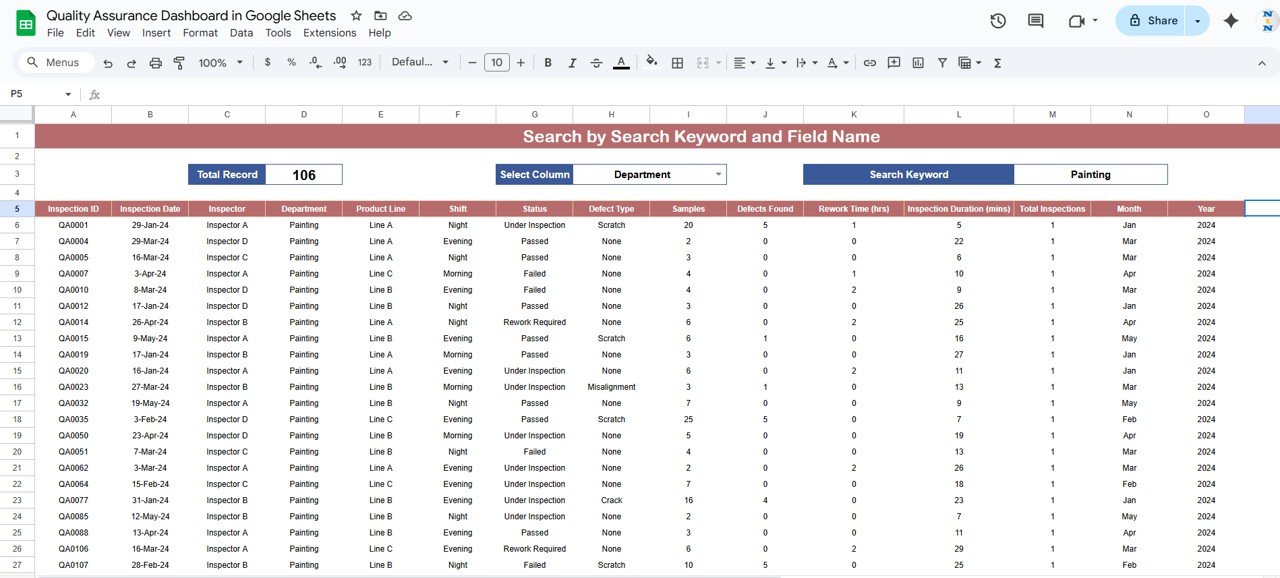
2. Search Sheet Tab
The Search Sheet allows users to quickly locate data by:
-
Search keyword
-
Field name
This feature makes it easy to filter specific samples, defect types, or inspector records.
Click to Buy Quality Assurance Dashboard in Google Sheets
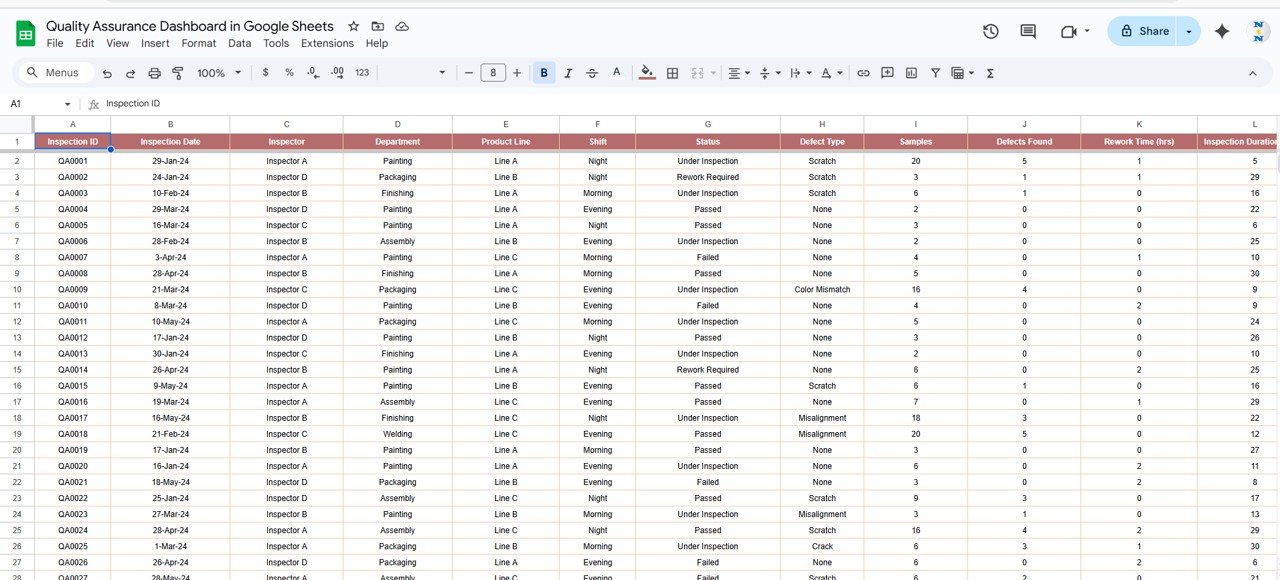
3. Data Sheet Tab
The Data Sheet serves as the input source for the dashboard:
-
Record all inspection results, defect types, and sample details
-
Include department, inspector, shift, and date information
-
Updates on this sheet automatically reflect in the Dashboard and Search sheets
This ensures accurate reporting and minimizes errors.
Click to Buy Quality Assurance Dashboard in Google Sheets
Advantages of Using the QA Dashboard
-
Centralized Data: Consolidates all quality metrics in one sheet
-
Real-Time Insights: Instant updates when new data is entered
-
Trend Analysis: Track defects, rework, and inspection trends over time
-
Department Performance: Identify high-risk areas or departments with quality issues
-
Inspector Performance Tracking: Monitor inspectors’ accuracy and efficiency
-
Continuous Improvement: Data-driven insights help reduce defects and rework
Best Practices for Using the Dashboard
-
Update Data Regularly: Ensure all sample and defect data is entered promptly
-
Segment Metrics: Analyze by department, inspector, shift, or defect type for detailed insights
-
Monitor Trends: Track monthly and weekly patterns in defects and rework
-
Set Targets: Establish acceptable defect rates and rework thresholds
-
Share Insights: Provide dashboards to production, QA, and management teams for actionable improvements
How This Dashboard Helps Quality Teams
Click to Buy Quality Assurance Dashboard in Google Sheets
-
Reduce Defects: Identify problem areas to take corrective action
-
Optimize Inspection Process: Monitor inspection durations and improve efficiency
-
Track Rework: Understand time and effort spent on corrections
-
Improve Accountability: Inspectors and departments can see performance trends
-
Support Continuous Improvement: Use insights for training, process changes, or preventive measures
Frequently Asked Questions (FAQs)
Q1: Can I add more metrics to this dashboard?
Yes, the dashboard is fully customizable. You can add additional KPIs such as customer complaints or product returns.
Q2: Can I filter data by department or shift?
Yes, the dashboard allows filtering by department, shift, inspector, or defect type for detailed analysis.
Q3: Is this suitable for large organizations with multiple departments?
Absolutely. Google Sheets can handle large datasets, and the dashboard will update automatically.
Q4: Can I track trends over months or years?
Yes, the Defects Found by Month chart helps monitor trends and seasonal patterns.
Q5: Can this dashboard help in compliance audits?
Yes, maintaining structured data and dashboards ensures documentation is available for audits.
Conclusion
Click to Buy Quality Assurance Dashboard in Google Sheets
The Quality Assurance Dashboard in Google Sheets is an essential tool for monitoring, analyzing, and improving product quality. With real-time insights, department and inspector-level tracking, and trend analysis, it empowers quality teams to make informed decisions, reduce defects, and enhance overall operational efficiency.
Visit our YouTube channel to learn step-by-step video tutorials
Youtube.com/@NeotechNavigators
Watch the step-by-step video Demo: