Have you ever been stuck trying to find specific data in a large Google Sheets file? It can be a bit overwhelming, right? Well, you’re in luck! In today’s post, we’ll show you exactly how to use the FILTER and SMALL Functions in Google Sheets to make this task quick and easy. Don’t worry if you’re new to this – we’ll break everything down in simple steps, so you can follow along with ease.
What You’ll Learn:
By the end of this guide, you’ll know how to use the FILTER and SMALL Functions together to grab the exact data you need. Let’s dive right in and get started!
The Dataset:
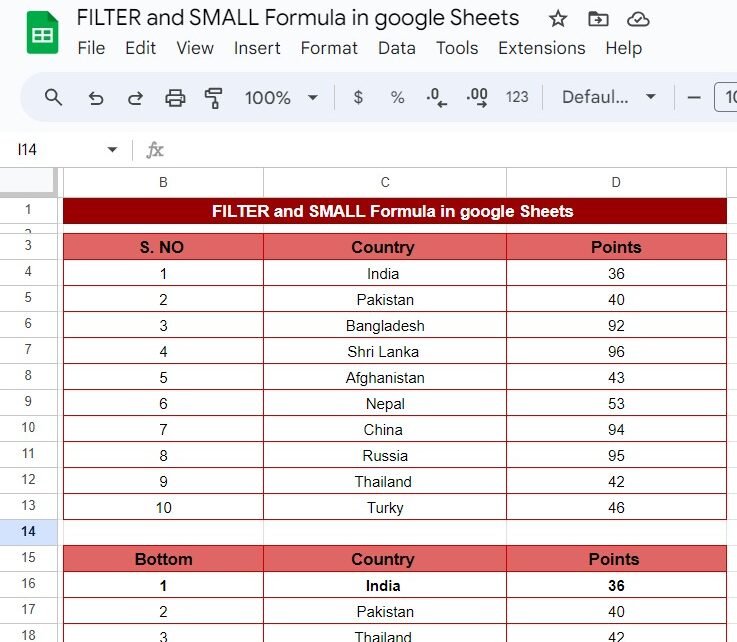
We’ll be working with the following list of countries and their points:

What’s the Goal?
Our goal is to find the three countries with the lowest points in this list. Sounds simple, right? Let’s see how we can do it with just one formula.
The Solution: Combining FILTER and SMALL
To get this done quickly, we’ll combine two functions: FILTER and SMALL. Here’s the magic formula that will help us find the answer:
=FILTER(C4:D13, D4:D13 <= SMALL(D4:D13, 3))
Sounds a bit technical? Don’t worry – let’s break it down together.
Breaking Down the Formula:
- FILTER(C4, D4<= SMALL(D4, 3)):First, the FILTER function looks at the range C4(which includes the countries and their points).
- Next, we add a condition: only include rows where the points (in column D) are less than or equal to the third smallest value.
Now, here’s where the SMALL(D4, 3) part comes in – this finds the third smallest number in the list, which is 42.
The Output:
Using this formula, here’s the result we get – the three countries with the lowest points:
That’s it! You’ve successfully filtered the list to show only the data you need. Pretty cool, right?

Why This Method is So Helpful:
By using the FILTER and SMALL functions together, you can save yourself tons of time. Instead of manually going through rows or sorting columns, these functions allow you to automatically pull out exactly what you need. This trick is especially handy when dealing with large datasets!
Wrapping It Up:
Now that you’ve learned how to use the FILTER and SMALL functions, you can apply this technique to all kinds of situations. Whether you’re working with small datasets or much larger ones, this formula will make it so much easier to get the information you’re looking for.
Visit our YouTube channel to learn step-by-step video tutorials
Youtube.com/@NeotechNavigators
View this post on Instagram