Managing a senior living facility requires careful monitoring of care quality, occupancy, staffing, and operational costs. The Senior Living KPI Dashboard in Google Sheets is a ready-to-use, dynamic tool designed to help administrators and managers track performance metrics with clarity and precision.
In this article, we’ll explore the structure, features, advantages, and best practices of this dashboard, along with examples of KPIs used in senior living management.
What Is a Senior Living KPI Dashboard?
A Senior Living KPI Dashboard is an analytical and visual management tool built in Google Sheets that tracks key performance indicators (KPIs) for senior care operations. It consolidates data from multiple areas — care services, occupancy, staff efficiency, safety, and financials — into one easy-to-read interface.
Using this dashboard, facility managers can:
-
Monitor month-to-date (MTD) and year-to-date (YTD) performance
-
Compare actual data with targets and previous years
-
Analyze trends in occupancy, satisfaction, and financial health
-
Identify areas for improvement in resident care and operations
Key Features of the Senior Living KPI Dashboard in Google Sheets
This dashboard includes six well-structured worksheets, designed to streamline performance tracking.
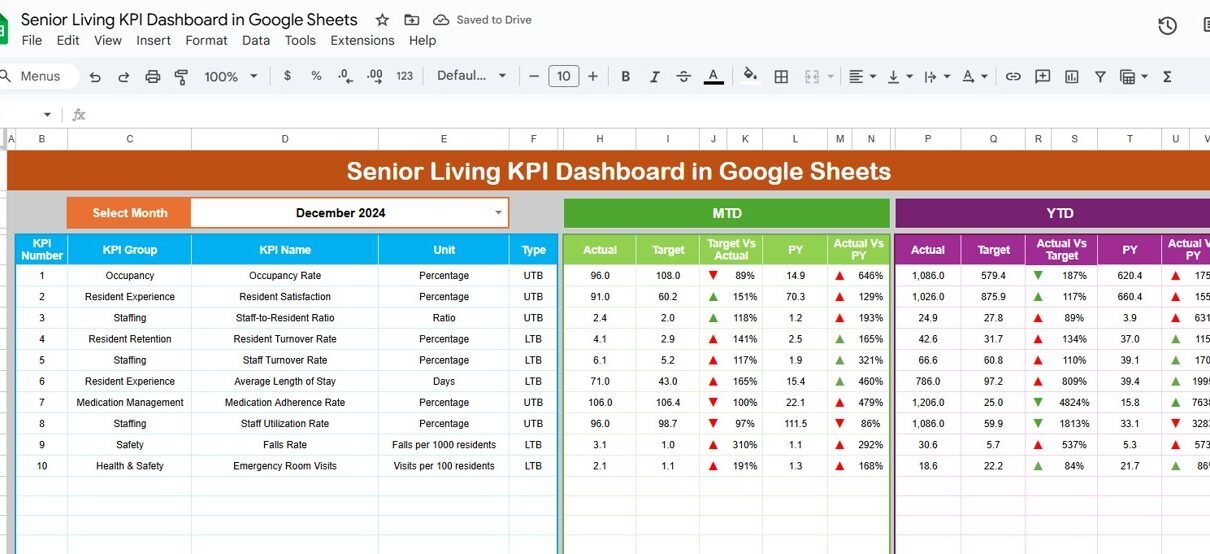
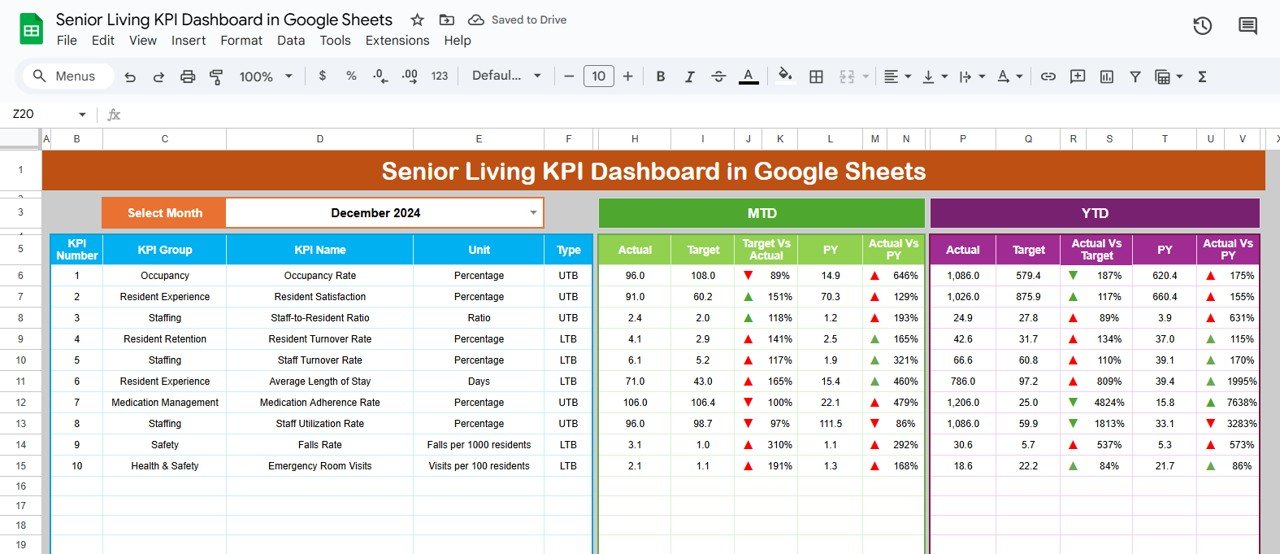
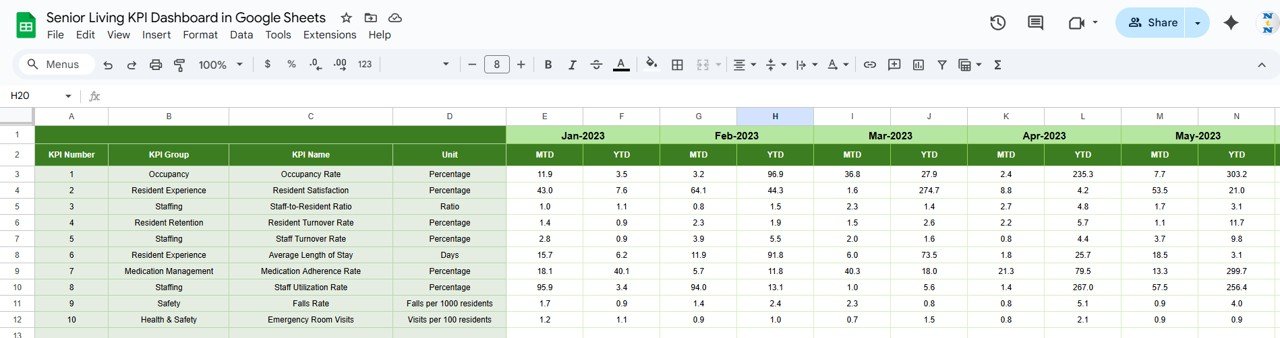
1. Dashboard Sheet Tab
This is the main sheet tab, where you can view all KPI data and performance summaries.
Highlights include:
-
Month Selection (Cell D3): Choose a month to refresh the dashboard metrics dynamically.
-
MTD Section: Displays Actual, Target, and Previous Year data with visual up/down arrows (green for improvement, red for decline).
-
YTD Section: Aggregated performance view with conditional formatting to visualize progress.
-
Comparisons: Target vs. Actual and Current Year vs. Previous Year for both MTD and YTD.
This visual representation allows quick performance evaluation at a glance.
Click to Buy Senior Living KPI Dashboard in Google Sheets
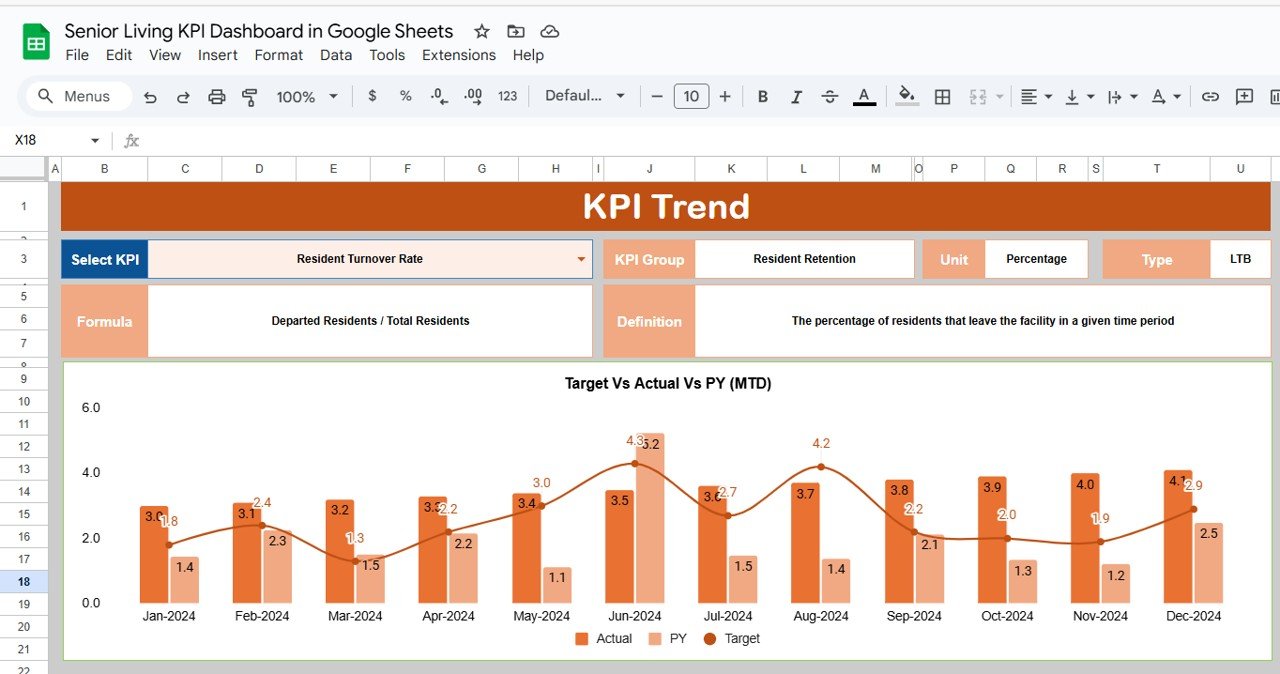
2. KPI Trend Sheet Tab
The KPI Trend Sheet helps analyze performance changes over time.
-
Select a KPI from a dropdown (Cell C3) to view its monthly trend.
-
Displays KPI Group, Unit, Type (Upper-The-Better or Lower-The-Better), Formula, and Definition.
-
Trend charts visualize progress throughout the year.
This tab is especially useful for identifying long-term patterns and improvement opportunities.
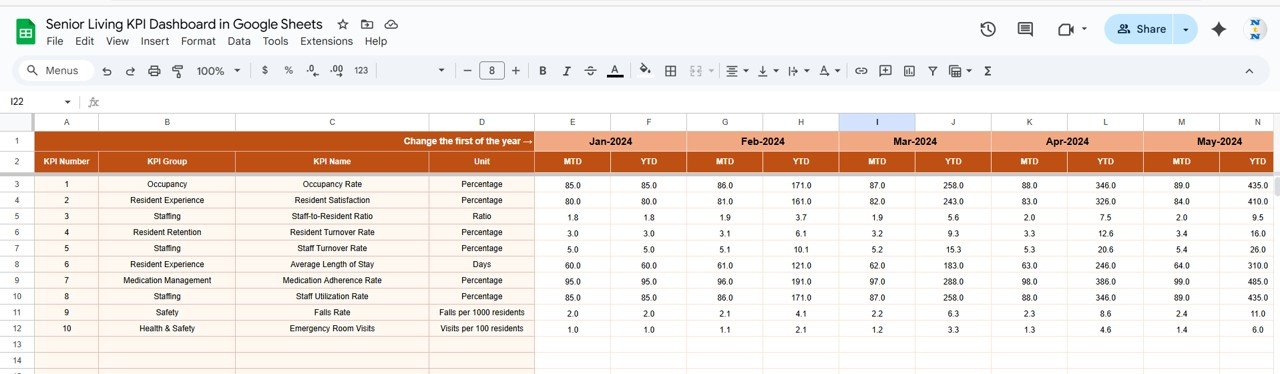
3. Actual Number Sheet Tab
In this tab, enter the actual MTD and YTD values for each KPI:
-
Update monthly using E1 to define the first month of the year.
-
Automatically integrates with Dashboard and Trend sheets.
Click to Buy Senior Living KPI Dashboard in Google Sheets
4. Target Sheet Tab
Set performance goals and benchmarks for each KPI:
-
Input Target MTD and YTD values for every month.
-
Compare with actual results in the Dashboard tab.
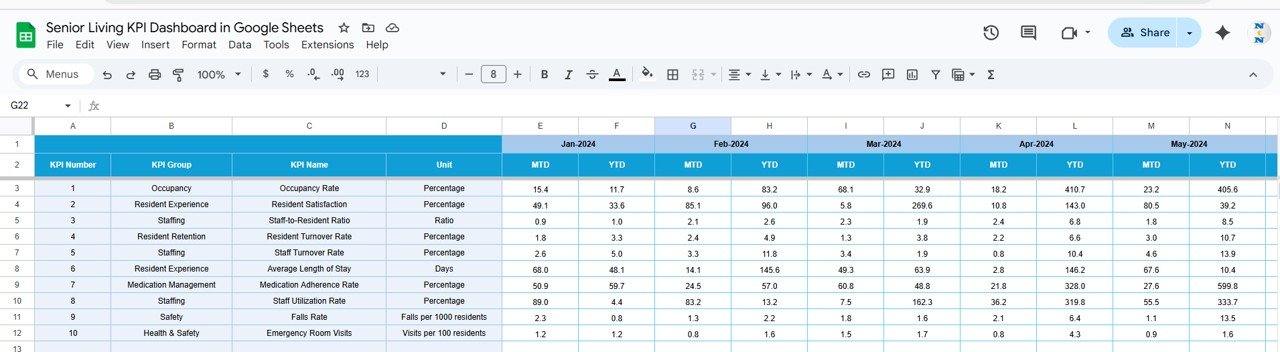
5. Previous Year Number Sheet Tab
This sheet stores previous year’s MTD and YTD data for comparison.
-
Allows year-over-year growth tracking.
-
Provides a clear understanding of operational progress.
Click to Buy Senior Living KPI Dashboard in Google Sheets
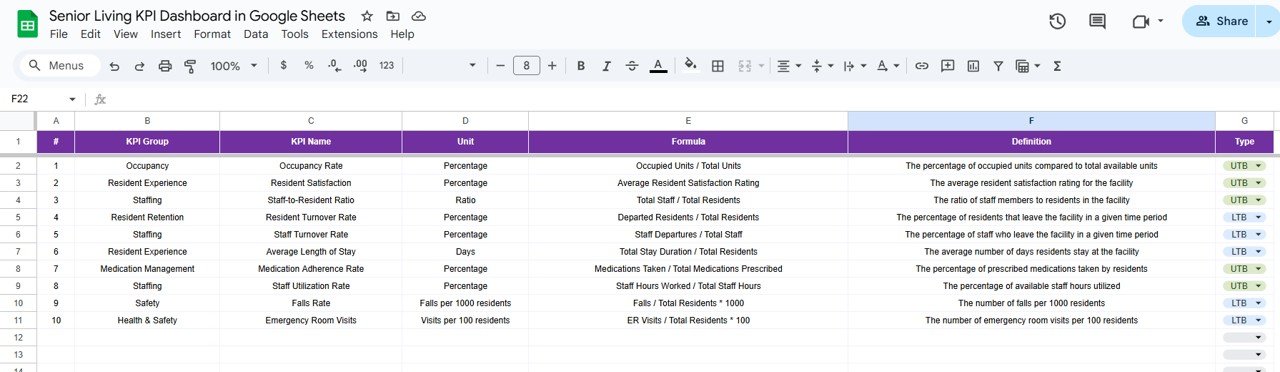
6. KPI Definition Sheet Tab
Define all KPIs in one place with clarity and consistency.
Include the following columns:
-
KPI Name
-
KPI Group
-
Unit
-
Formula
-
Definition
-
Type: Lower-The-Better (LTB) or Upper-The-Better (UTB)
This ensures that all stakeholders interpret and track performance metrics uniformly.
Advantages of Using a Senior Living KPI Dashboard
✅ Centralized Data Management – Combine financial, operational, and resident care data in one place.
✅ Real-Time Monitoring – Instantly visualize MTD and YTD metrics with conditional formatting.
✅ Informed Decision-Making – Identify areas that need immediate improvement.
✅ Performance Comparison – Evaluate progress against targets and past performance.
✅ Customizable Metrics – Add or modify KPIs based on your facility’s needs.
✅ Cloud Collaboration – Google Sheets allows multiple team members to update or review the dashboard simultaneously.
Best Practices for Using the Dashboard
-
Update Data Monthly: Regular data entry ensures accurate MTD/YTD tracking.
-
Define Clear KPI Targets: Set realistic goals that reflect operational priorities.
-
Review Trends Quarterly: Use the KPI Trend sheet for quarterly evaluations.
-
Involve Department Heads: Assign KPI responsibility to specific departments.
-
Use Conditional Formatting: Quickly highlight KPIs that need attention.
-
Customize KPIs: Adapt metrics to reflect your facility’s goals, such as safety, comfort, and efficiency.
How This Dashboard Helps Senior Living Management
Click to Buy Senior Living KPI Dashboard in Google Sheets
-
Improves Care Quality: Track satisfaction, incident rates, and response times.
-
Optimizes Resource Use: Analyze occupancy and staffing to enhance efficiency.
-
Increases Transparency: Communicate performance metrics with leadership and staff.
-
Enhances Financial Control: Compare actual vs. target costs and revenues.
-
Supports Continuous Improvement: Identify performance gaps early for proactive management.
Frequently Asked Questions (FAQs)
Click to Buy Senior Living KPI Dashboard in Google Sheets
Q1: Can I customize KPIs for my senior living facility?
Yes. You can modify KPI names, formulas, and definitions in the KPI Definition sheet.
Q2: How often should I update the data?
You can update it monthly or quarterly depending on your reporting cycle.
Q3: Can I track multiple facilities in one dashboard?
Yes. You can add facility-level columns or duplicate sheets for each branch.
Q4: Does it work on mobile devices?
Yes, since it’s built in Google Sheets, it’s fully accessible on any device.
Q5: Is prior technical knowledge required?
No. The dashboard is beginner-friendly and requires basic Excel or Sheets familiarity.
Conclusion
The Senior Living KPI Dashboard in Google Sheets is an essential tool for administrators and facility managers to monitor performance, ensure compliance, and improve care quality. With automated MTD/YTD tracking, conditional formatting, and trend analysis, this dashboard empowers senior living facilities to make data-driven decisions and enhance both operational and resident satisfaction.
Visit our YouTube channel to learn step-by-step video tutorials
Youtube.com/@NeotechNavigators