Running a childcare center involves managing multiple moving parts — from staff performance and child enrollment to parent satisfaction and financial stability. The Childcare Center KPI Dashboard in Google Sheets offers an efficient way to monitor all these aspects in one place. This ready-to-use dashboard helps administrators and educators track key performance indicators (KPIs), identify trends, and make informed decisions that improve operations and outcomes.Childcare Center KPI Dashboard in Google Sheets
What Is a Childcare Center KPI Dashboard in Google Sheets?
A Childcare Center KPI Dashboard is a data-driven management tool designed to track and visualize the most important metrics related to your childcare operations. It helps directors and administrators gain insights into performance areas such as:Childcare Center KPI Dashboard in Google Sheets
-
Enrollment and capacity utilization
-
Staff-to-child ratio
-
Parent satisfaction and feedback
-
Financial performance
-
Training and compliance
By consolidating data into visual charts and metrics, this Google Sheets-based dashboard provides a clear snapshot of progress and challenges across months and years.
Key Features of the Childcare Center KPI Dashboard in Google Sheets
Click to Buy Childcare Center KPI Dashboard in Google Sheets
This dashboard includes 6 worksheets, each designed to make performance monitoring seamless and insightful:
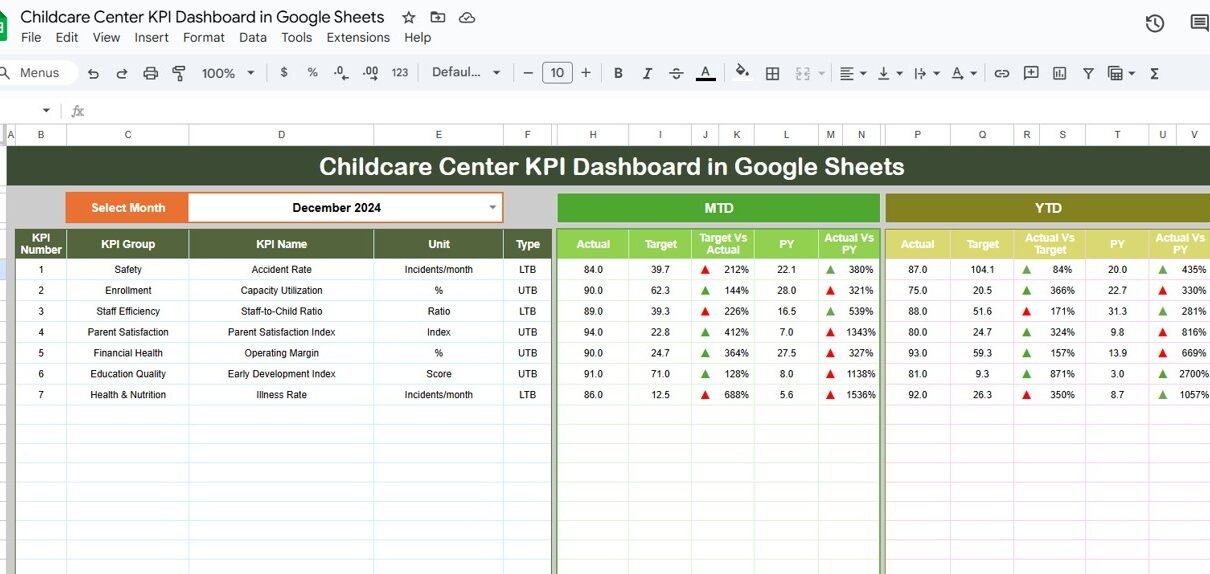
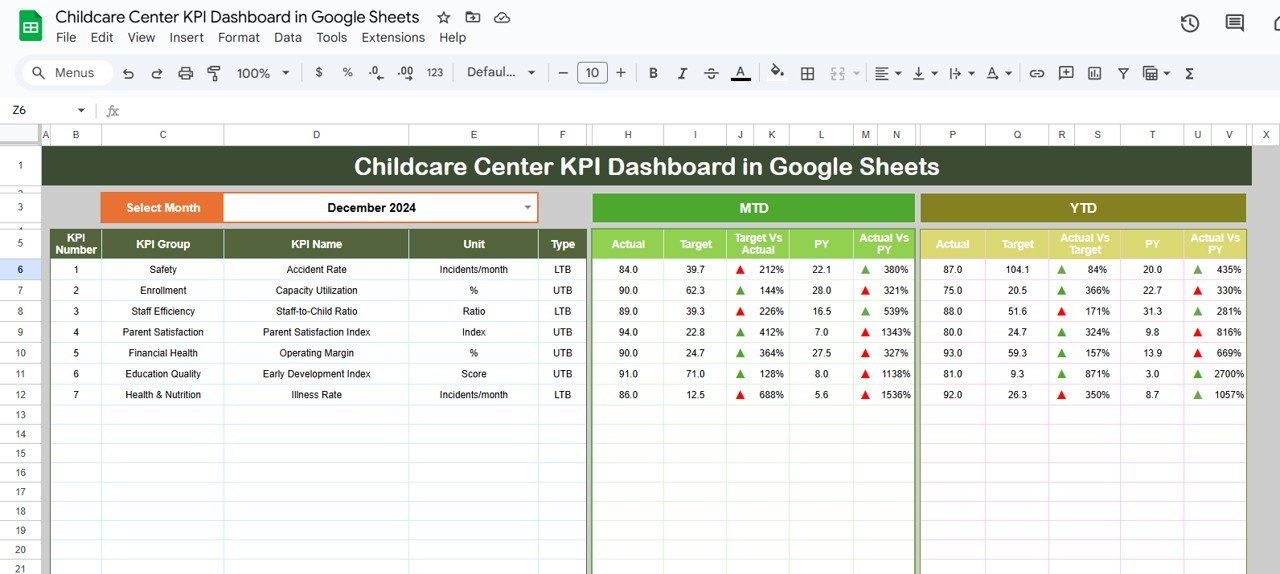
1. Dashboard Sheet Tab
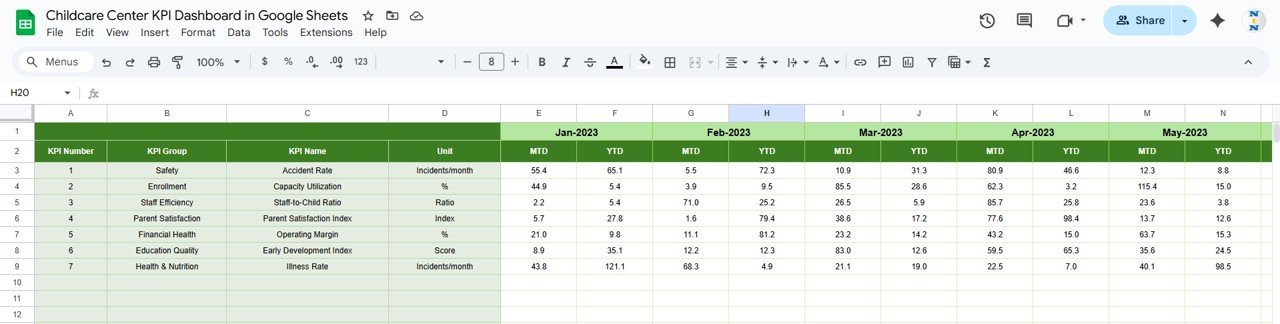
The main dashboard presents a summary of all KPIs for a selected month.
-
On Range D3, you can select the month from a dropdown.
-
Displays MTD (Month-to-Date) and YTD (Year-to-Date) metrics, including actuals, targets, and comparisons with previous year data.
-
Conditional formatting with arrows (↑ or ↓) highlights whether performance has improved or declined.
-
KPIs automatically update when data changes, ensuring real-time insights.
This sheet allows administrators to review overall performance at a glance.
Click to Buy Childcare Center KPI Dashboard in Google Sheets
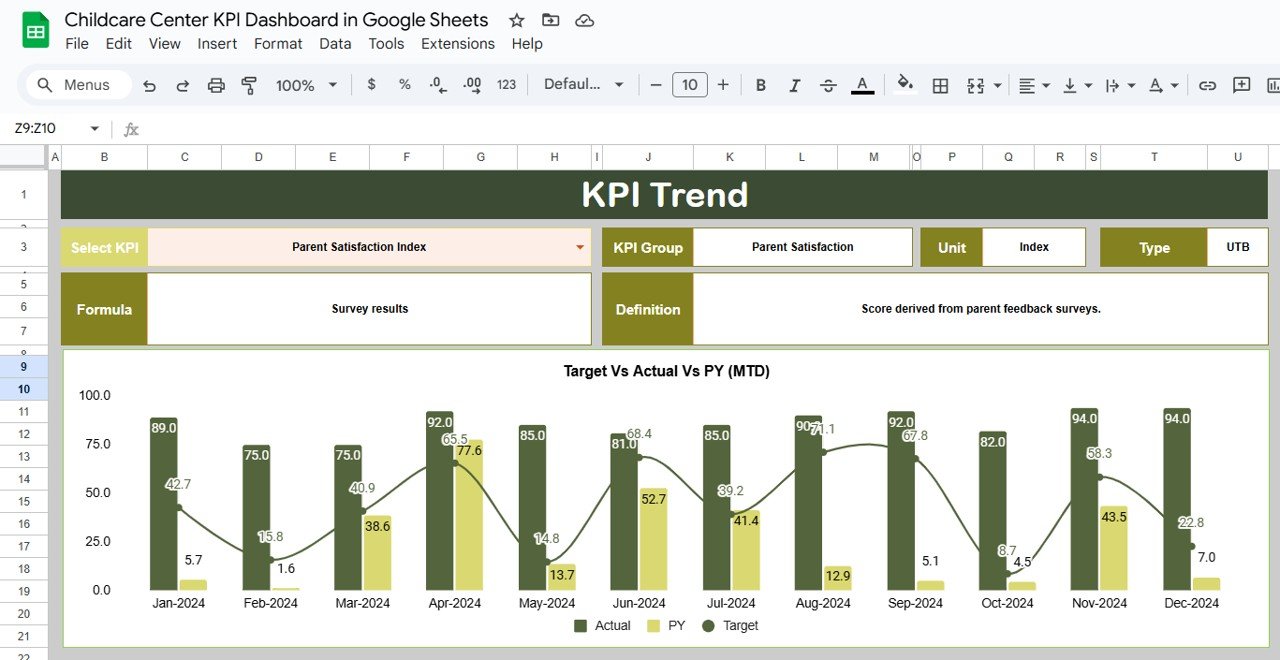
2. KPI Trend Sheet Tab Childcare Center KPI Dashboard in Google Sheets
The KPI Trend Sheet helps visualize trends over time for each KPI.
-
Select a KPI name from the dropdown in Range C3.
-
View details like KPI Group, Unit, Formula, and whether it’s Upper-the-Better (UTB) or Lower-the-Better (LTB).
-
Line charts or combo charts display how each KPI has evolved month by month.
This page is ideal for spotting long-term patterns and performance improvements.
Click to Buy Childcare Center KPI Dashboard in Google Sheets
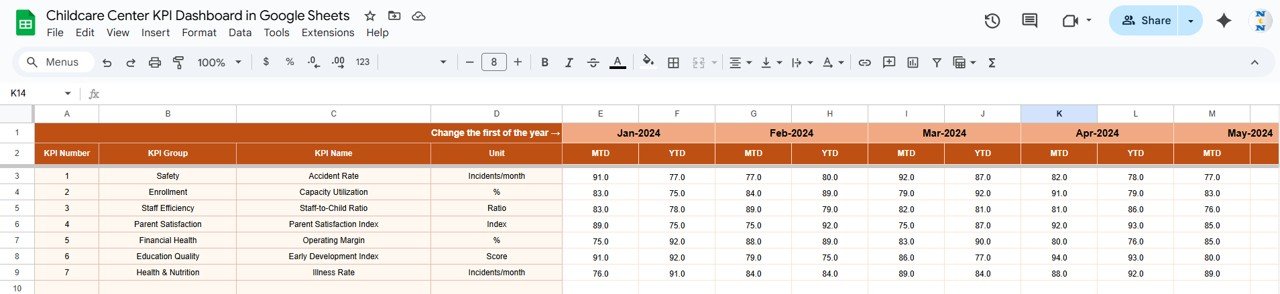
3. Actual Number Sheet Tab
This sheet is used for entering actual performance data.
-
Record MTD and YTD values for every KPI.
-
Enter the first month of the fiscal year in Range E1; the rest updates automatically.
-
Ensures accurate reflection of current performance metrics.
4. Target Sheet Tab
The Target Sheet allows you to set performance goals.
-
Enter target values for each KPI on a monthly and yearly basis.
-
Compare actual data against targets to identify areas needing improvement.
Click to Buy Childcare Center KPI Dashboard in Google Sheets
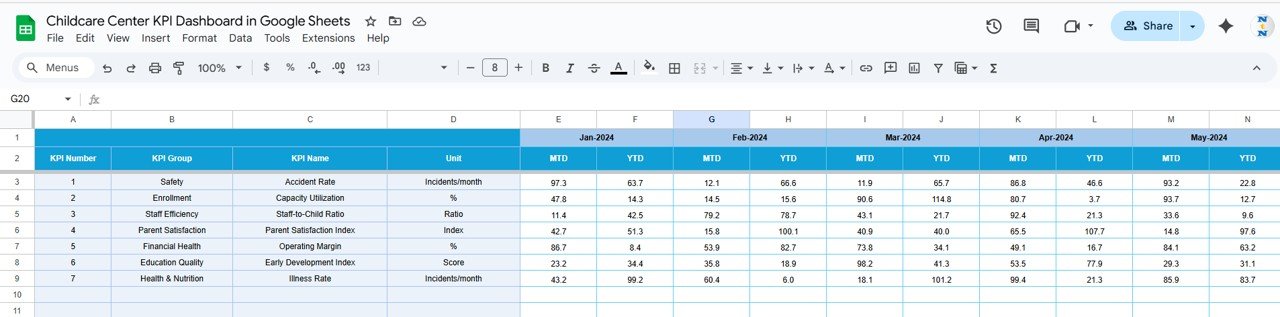
5. Previous Year Numbers Sheet Tab
This sheet contains previous year’s data for comparison purposes.
-
Enables year-over-year analysis for every KPI.
-
Helps identify progress, growth trends, or areas that require more attention.
6. KPI Definition Sheet Tab
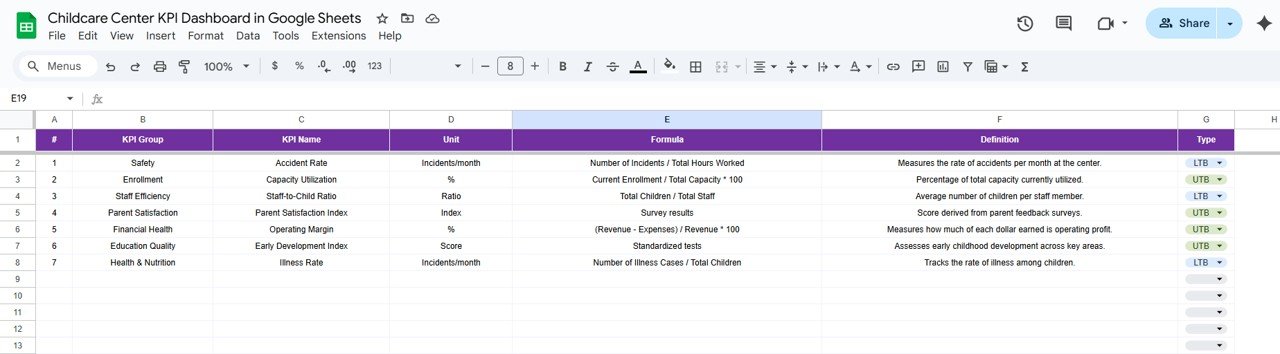
The KPI Definition Sheet is the knowledge base for your dashboard.
Lists each KPI with columns for:
- KPI Name
- KPI Group (e.g., Operations, Finance, HR, Education)
- Unit (%, $, count, etc.)
- Formula
- Definition
- Type – LTB (Lower-the-Better) or UTB (Upper-the-Better)
This ensures transparency and consistency when tracking and reporting performance.
Click to Buy Childcare Center KPI Dashboard in Google Sheets
Advantages of Using the Childcare Center KPI Dashboard
✅ Centralized Data Monitoring: Track every operational, financial, and engagement metric in one place.
✅ Performance Transparency: Compare MTD, YTD, and previous year results easily.
✅ Actionable Insights: Identify weak areas and implement corrective actions.
✅ Real-Time Updates: Automatically refresh data as inputs change.
✅ User-Friendly Design: Simple dropdowns, dynamic charts, and color-coded indicators.
✅ Scalable: Add more KPIs or modify formulas as your center expands.
Best Practices for Using the Dashboard
-
📅 Update Data Monthly: Ensure data accuracy for meaningful trend analysis.
-
🎯 Set SMART Targets: Define realistic, measurable goals for each KPI.
-
🧩 Customize KPIs: Adjust KPIs based on the center’s size and priorities.
-
🧠 Train Staff: Encourage staff to understand and use dashboard insights.
-
📊 Review Regularly: Analyze trends quarterly to improve operational strategies.
-
💬 Share Reports: Present dashboard summaries to stakeholders and parents to maintain transparency.
How This Dashboard Helps Childcare Administrators
Click to Buy Childcare Center KPI Dashboard in Google Sheets
-
Tracks enrollment, attendance, and satisfaction trends easily.
-
Monitors staff performance and training completion rates.
-
Helps maintain regulatory compliance through safety and training KPIs.
-
Provides financial visibility by tracking costs, revenue, and profitability.
-
Improves decision-making with visualized data and trend analysis.
Frequently Asked Questions (FAQs)
Q1: Can I customize KPIs in this dashboard?
Yes, you can add, modify, or remove KPIs as per your center’s needs in the KPI Definition sheet.
Q2: How often should I update the data?
It’s recommended to update data monthly or weekly for accurate tracking.
Q3: Can this dashboard be used for multiple branches?
Yes, you can duplicate sheets for each branch and consolidate results into one summary dashboard.
Q4: Do I need advanced Excel or Google Sheets knowledge?
No, the dashboard is pre-built with formulas and drop-down menus — no advanced knowledge is required.
Q5: Can this dashboard generate visual performance reports?
Yes, charts and graphs are automatically updated for easy visualization and presentation.
Conclusion
Click to Buy Childcare Center KPI Dashboard in Google Sheets
The Childcare Center KPI Dashboard in Google Sheets is a must-have tool for administrators who want to manage operations effectively. It centralizes data, visualizes trends, and simplifies decision-making. With this dashboard, you can ensure consistent quality, improve staff performance, enhance parent satisfaction, and achieve long-term success in your childcare operations.
Visit our YouTube channel to learn step-by-step video tutorials
Youtube.com/@NeotechNavigators
Watch the step-by-step video Demo:
Click to Buy Childcare Center KPI Dashboard in Google Sheets