Monitoring compliance across departments is essential for maintaining organizational integrity, meeting legal requirements, and ensuring timely regulatory submissions. The Compliance Management Dashboard in Google Sheets is a ready-to-use, interactive dashboard designed to track, analyze, and visualize compliance performance efficiently.Compliance Management Dashboard in Google Sheets
This article provides a complete oyverview of the dashboard, including its structure, KPIs, key features, and best practices for optimal usage.Compliance Management Dashboard in Google Sheets
What Is a Compliance Management Dashboard in Google Sheets?
A Compliance Management Dashboard is a dynamic data visualization tool that allows organizations to track compliance activities, monitor deadlines, and evaluate overall compliance performance in real-time.Compliance Management Dashboard in Google Sheets
Developed in Google Sheets, this dashboard consolidates compliance data across departments, priorities, and compliance areas. It provides actionable insights through charts, scorecards, and visual indicators — all accessible and shareable in the cloud.Compliance Management Dashboard in Google Sheets
This tool is ideal for compliance officers, audit teams, and managers who need real-time visibility into compliance performance and potential risk areas.Compliance Management Dashboard in Google Sheets
Structure of the Dashboard
Click to Buy Compliance Management Dashboard in Google Sheets
The Compliance Management Dashboard is organized into multiple sheet tabs for ease of navigation and comprehensive analysis:
Overview Sheet Tab
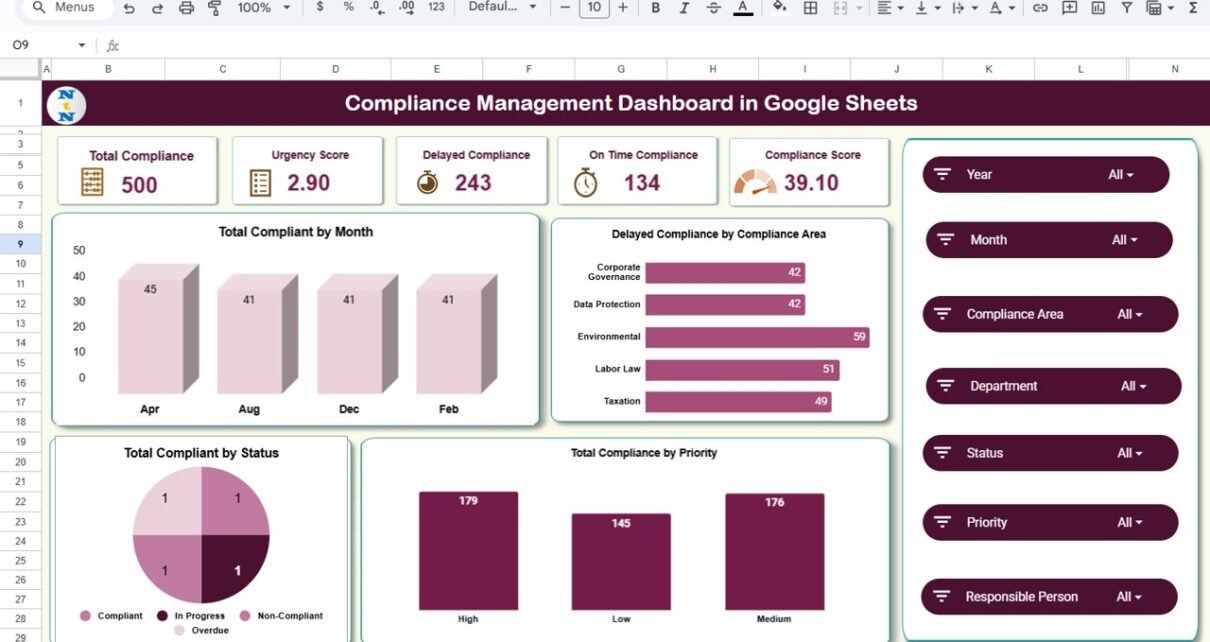
The Overview Sheet provides a summary of key compliance performance indicators. It offers a snapshot view of total compliance activities, delayed cases, and on-time performance.
Cards Displayed:
-
Total Compliance: The total number of compliance records tracked.
-
Urgency Score: A weighted score reflecting compliance criticality.
-
Delayed Compliance: The number of compliance items not completed within deadlines.
-
On-Time Compliance: Total compliance items completed as per schedule.
-
Compliance Score: The overall compliance health represented as a percentage.
Charts Displayed:
-
Total Compliance by Month – Tracks how many compliance items were reported each month.
-
Delayed Compliance by Compliance Area – Highlights compliance areas with missed deadlines.
-
Total Compliance by Priority – Shows the distribution of compliance activities by urgency (High, Medium, Low).
-
Total Compliance by Status – Illustrates the breakdown of compliance records by their current status.
This section gives management a clear picture of organizational compliance status at a glance.

Click to Buy Compliance Management Dashboard in Google Sheets
Compliance Analysis Sheet Tab
The Compliance Analysis sheet provides a deep dive into performance by compliance area.
Charts Displayed:
-
Total Compliance by Compliance Area – Counts total compliance activities per category (e.g., Financial, Data Privacy, Safety).
-
On-Time Compliance by Compliance Area – Tracks timely completions by compliance type.
-
Compliance Score by Compliance Area – Measures how well each area adheres to standards.
This sheet helps identify strengths and weaknesses across compliance domains.

Department Analysis Sheet Tab
The Department Analysis Tab evaluates compliance adherence across organizational units.
Charts Displayed:
-
Total Compliance by Department
-
On-Time Compliance by Department
-
Compliance Score by Department
These charts help identify which departments perform best in timely completion and which need intervention or additional resources.

Click to Buy Compliance Management Dashboard in Google Sheets
Priority Analysis Sheet Tab
The Priority Analysis Tab assesses compliance performance based on priority levels.
Charts Displayed:
-
Total Compliance by Priority
-
On-Time Compliance by Priority
-
Compliance Score by Priority
This allows managers to evaluate whether critical compliance items receive the attention they require.

Click to Buy Compliance Management Dashboard in Google Sheets
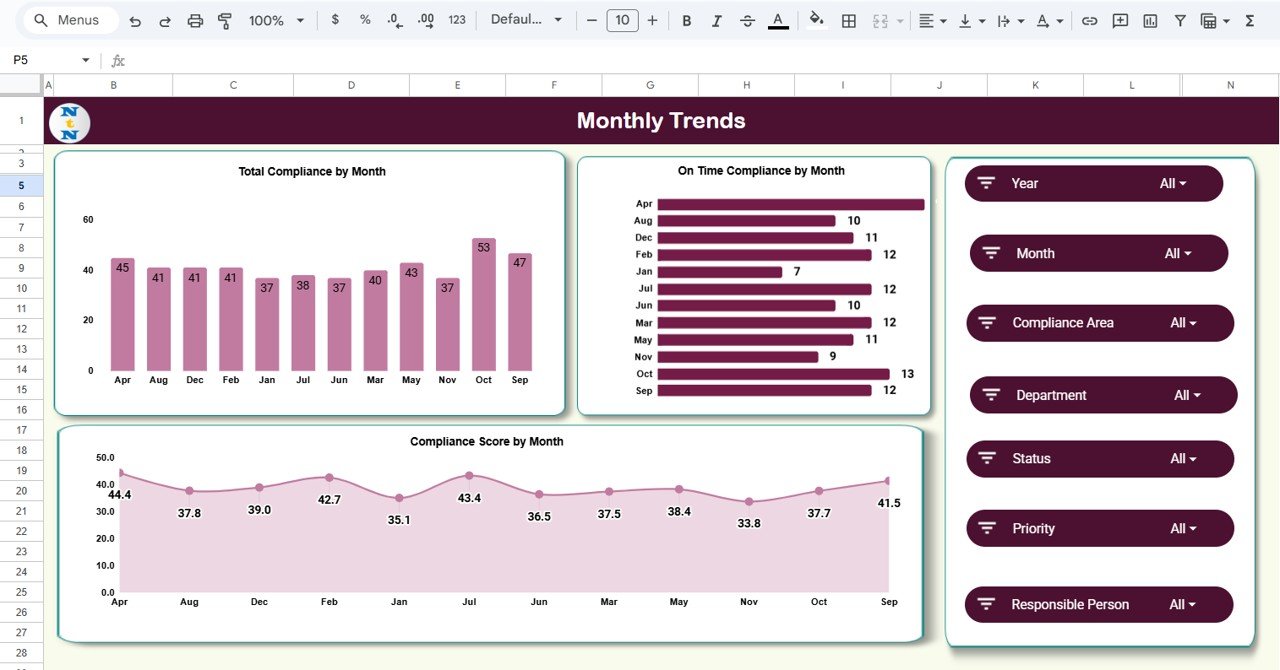
Monthly Trends Sheet Tab
The Monthly Trends Tab presents performance progress over time.
Charts Displayed:
-
Total Compliance by Month
-
On-Time Compliance by Month
-
Compliance Score by Month
This helps teams analyze seasonal trends, recurring compliance issues, and improvement over months.
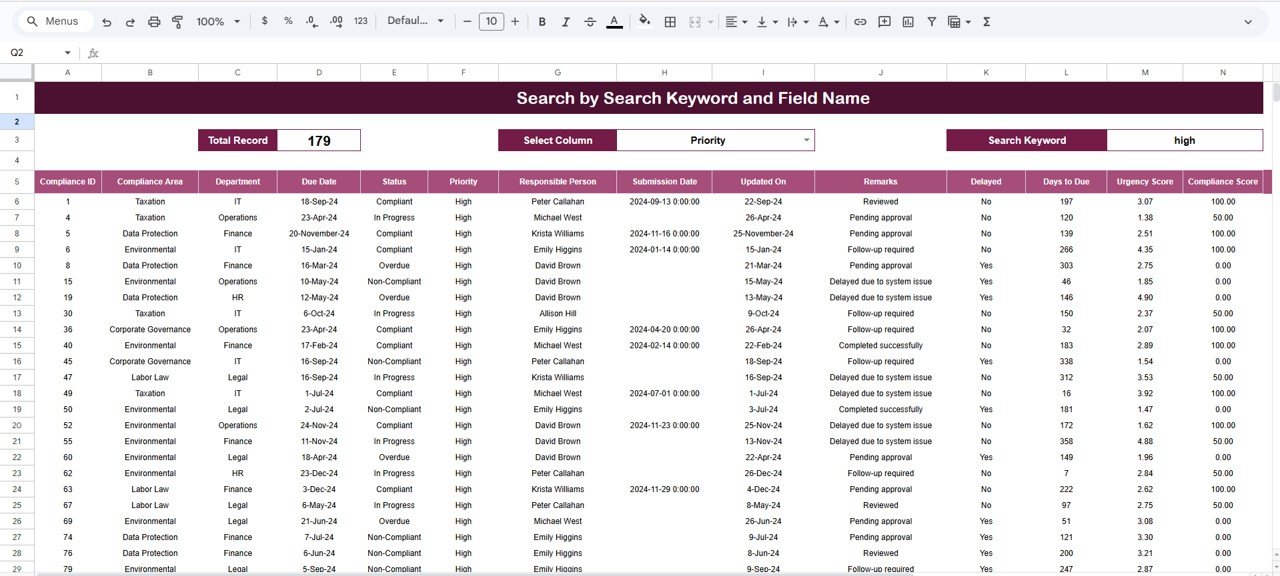
Search Sheet Tab
The Search Sheet Tab allows users to search for any compliance record using keywords or field names.
Examples:
-
Search for “High Priority” → Lists all high-priority compliance tasks.
-
Search for “Finance Department” → Displays compliance items related to Finance.
-
Search for “Delayed” → Filters all overdue compliance items.
This feature simplifies navigation and enables quick data retrieval.
Click to Buy Compliance Management Dashboard in Google Sheets
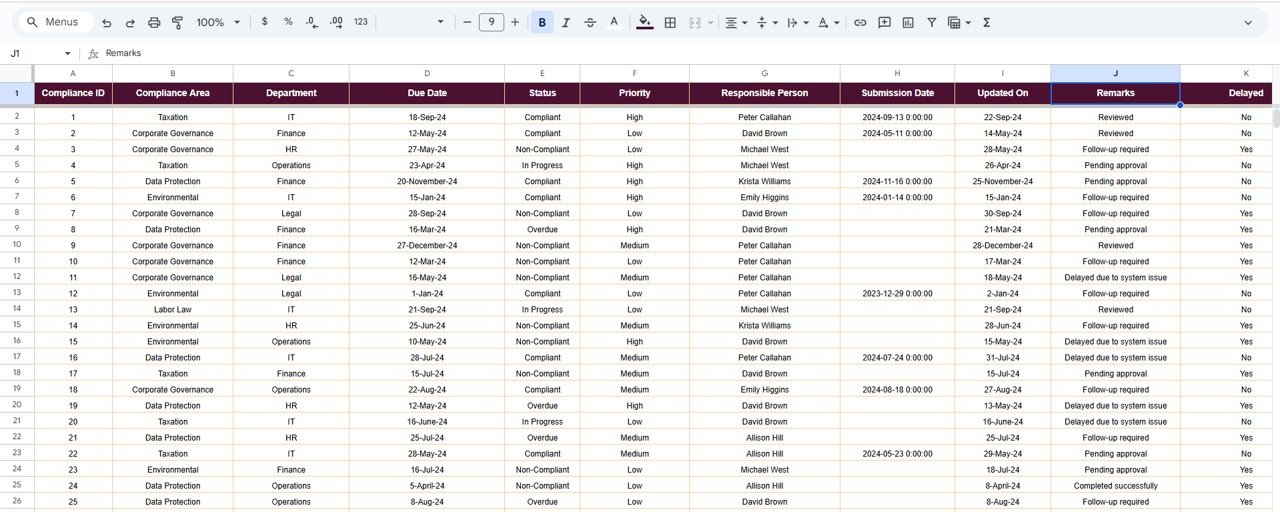
Data Sheet Tab
This is the core sheet where all compliance data is stored and maintained.
Advantages of the Compliance Management Dashboard
-
Centralized Compliance Tracking: Consolidates compliance data in one sheet.
-
Automated Visualization: Charts and KPIs refresh dynamically.
-
Cross-Department Insights: Compare performance across departments and areas.
-
Time Efficiency: Saves manual reporting effort through automation.
-
Easy Collaboration: Multiple users can access and update the dashboard in real time.
-
Customizable Template: Easily modify or expand KPIs as per organizational requirements.
Opportunities for Improvement
Click to Buy Compliance Management Dashboard in Google Sheets
Enhance dashboard functionality by:
-
Integrating with Google Forms for automated compliance updates.
-
Adding Risk Indicators to measure compliance impact severity.
-
Including Notifications for overdue tasks using Google Apps Script.
-
Implementing Conditional Formatting to highlight critical compliance areas.
-
Creating Department-Level Filters for quick analysis.
Best Practices
Click to Buy Compliance Management Dashboard in Google Sheets
-
Update data weekly to ensure accuracy.
-
Maintain consistent naming conventions for compliance areas and departments.
-
Regularly review monthly trend data to detect recurring issues.
-
Protect formula cells and KPI tabs to prevent accidental edits.
-
Use color-coded visuals for better interpretation of high-risk items.
Conclusion
The Compliance Management Dashboard in Google Sheets is a complete compliance tracking solution that enhances visibility, accountability, and performance management.
By consolidating data, automating KPIs, and providing actionable visuals, it helps organizations stay compliant with internal policies and external regulations.
Visit our YouTube channel to learn step-by-step video tutorials
Youtube.com/@NeotechNavigators
Watch the step-by-step video Demo:
Click to Buy Compliance Management Dashboard in Google Sheets