A/B testing plays a critical role in data-driven decision-making. Businesses constantly test landing pages, ads, emails, pricing, layouts, and features to improve conversions and user experience. However, many teams struggle to measure A/B test performance clearly because data stays scattered across tools, reports, and spreadsheets.
That is exactly why an A/B Testing KPI Dashboard in Google Sheets becomes essential.
This ready-to-use dashboard centralizes all A/B testing KPIs into one interactive, easy-to-use reporting system. It tracks performance at both MTD (Month-to-Date) and YTD (Year-to-Date) levels while comparing Actual vs Target and Current Year vs Previous Year. As a result, teams gain clarity, confidence, and faster insights.
In this article, you will learn how the dashboard works, which KPIs it includes, how each worksheet functions, and how organizations can improve experimentation success using structured KPI tracking.
What Is an A/B Testing KPI Dashboard in Google Sheets?
Click to Buy A/B Testing KPI Dashboard in Google Sheets
An A/B Testing KPI Dashboard is a centralized analytics tool that measures the effectiveness of experiments by tracking key performance indicators related to conversions, engagement, revenue, and statistical reliability.
Instead of reviewing individual test reports, this dashboard consolidates all A/B test data into one structured Google Sheets file. Consequently, teams can:
-
Track experiment performance monthly and yearly
-
Compare test results against targets
-
Identify winning variations faster
-
Improve experimentation discipline
-
Support data-driven decisions
Because the dashboard runs entirely in Google Sheets, it remains simple, collaborative, cost-effective, and highly customizable.
Key Worksheets in the A/B Testing KPI Dashboard
The dashboard contains 6 structured worksheets, each serving a specific purpose.
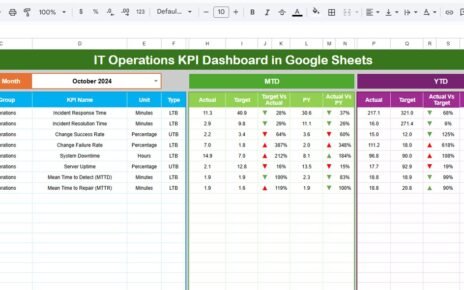
1. Dashboard Sheet Tab (Main Sheet)
This is the primary reporting page.
-
Select the Month from cell D3
-
All KPIs update automatically for that month
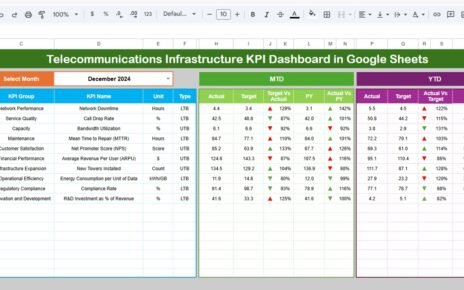
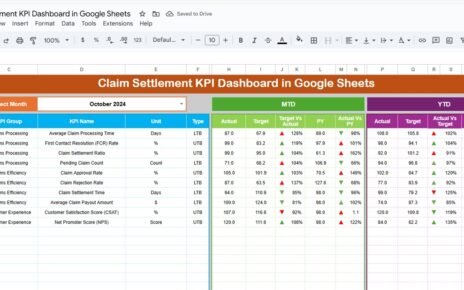
The dashboard displays:
MTD Metrics
-
MTD Actual
-
MTD Target
-
MTD Previous Year
-
Target vs Actual
-
Previous Year vs Actual
YTD Metrics
-
YTD Actual
-
YTD Target
-
YTD Previous Year
-
Target vs Actual
-
Previous Year vs Actual
Conditional formatting with up/down arrows highlights performance trends instantly.

Click to Buy A/B Testing KPI Dashboard in Google Sheets
2. KPI Trend Sheet Tab
This sheet helps analyze individual KPIs over time.
-
Select KPI name from dropdown in C3
-
Displays:
-
KPI Group
-
Unit
-
KPI Type (UTB / LTB)
-
Formula
-
KPI Definition
-
Line charts show month-wise trends to identify improvement or decline.

Click to Buy A/B Testing KPI Dashboard in Google Sheets
3. Actual Number Sheet Tab
This is the data entry sheet for actual performance.
-
Enter MTD and YTD values
-
Select the first month of the year in E1
-
Monthly structure adjusts automatically
All dashboard values update instantly based on this data.

Click to Buy A/B Testing KPI Dashboard in Google Sheets
4. Target Sheet Tab
This sheet stores planned targets for each KPI.
-
Monthly (MTD) targets
-
Yearly (YTD) targets
Targets help measure whether experiments deliver expected outcomes.

5. Previous Year Number Sheet Tab
This sheet stores last year’s KPI values.
It supports:
-
Year-over-Year comparison
-
Long-term performance evaluation
-
Trend consistency analysis

Click to Buy A/B Testing KPI Dashboard in Google Sheets
6. KPI Definition Sheet Tab
This reference sheet defines all KPIs clearly.
It contains:
-
KPI Name
-
KPI Group
-
Unit
-
Formula
-
Definition
-
KPI Type (Lower the Better / Upper the Better)
This ensures standard understanding across teams.

Click to Buy A/B Testing KPI Dashboard in Google Sheets
Advantages of an A/B Testing KPI Dashboard
-
Improves decision-making speed
-
Eliminates guesswork
-
Standardizes experimentation metrics
-
Increases conversion optimization success
-
Aligns teams with clear performance goals
-
Reduces reporting effort
Opportunities for Improvement in A/B Testing
-
Add automated data imports from testing tools
-
Segment KPIs by channel or device
-
Introduce experiment maturity scoring
-
Track hypothesis success rates
-
Add AI-based test recommendations
Best Practices for Using the A/B Testing Dashboard
Click to Buy A/B Testing KPI Dashboard in Google Sheets
-
Define KPIs before launching tests
-
Maintain consistent test durations
-
Avoid overlapping experiments
-
Review results monthly and quarterly
-
Focus on business impact, not vanity metrics
-
Use previous year data for maturity tracking
Conclusion
An A/B Testing KPI Dashboard in Google Sheets brings structure, clarity, and accountability to experimentation programs. It transforms raw test data into actionable insights using clear KPIs, monthly tracking, and trend analysis. Because the dashboard runs in Google Sheets, teams can collaborate easily without complex tools.
When used consistently, this dashboard helps organizations improve conversion rates, user experience, and revenue through disciplined experimentation.
Frequently Asked Questions (FAQs)
Click to Buy A/B Testing KPI Dashboard in Google Sheets
1. Who should use an A/B Testing KPI Dashboard?
Marketing, product, UX, CRO, and growth teams.
2. Is this dashboard suitable for beginners?
Yes, it uses simple formulas and structured inputs.
3. Can I add more KPIs later?
Yes, the KPI Definition sheet supports expansion.
4. Does it support YoY analysis?
Yes, through the Previous Year sheet.
5. Do I need coding skills?
No, basic Google Sheets knowledge is enough.
Visit our YouTube channel to learn step-by-step video tutorials
Youtube.com/@NeotechNavigators
Watch the step-by-step video tutorial: