Accounting firms and professional services practices lose an average of 5–10% of billable revenue annually to unrecovered WIP, billing delays, and poor engagement visibility — yet most practices still rely on manually compiled Excel reports that are days out of date by the time partners see them. The Accounting Firm Revenue Dashboard in Google Sheets addresses this gap by consolidating engagement-level revenue, billable hours, WIP exposure, and billing status across 5 dedicated analysis pages with slicer-powered filtering and an Engagement ID lookup tab that surfaces any engagement record in seconds. Built for accounting partners, practice managers, and finance operations teams who need real-time visibility without rebuilding formulas each month or paying $49–$200 per user per month for Karbon, Clio, or CCH practice management software.Accounting Firm Revenue Dashboard in Google Sheets
The dashboard runs entirely in Google Sheets — no plugins, no desktop software, no IT setup. Copy the template to your Google Drive, replace the sample data in the Data Sheet with your firm’s actual engagement records, and every chart and KPI card updates automatically. Setup takes under 10 minutes, and the 5-page structure — Overview, Revenue, Workload, Clients, and Search — gives every stakeholder the analytical view they need without sharing the raw data table.Accounting Firm Revenue Dashboard in Google Sheets
Key Features of the Accounting Firm Revenue Dashboard in Google Sheets
- Google Sheets format — opens in any browser, shareable via Google Drive, real-time collaboration with partners and finance staff, no Microsoft license required.Accounting Firm Revenue Dashboard in Google Sheets
- 4 headline KPI cards on the Overview page — Total Fees, Billable Hours, Effective Rate, and Total WIP — updated instantly when slicers are applied.Accounting Firm Revenue Dashboard in Google Sheets
- Multiple slicers on the Overview page — filter the entire dashboard by Partner, Service Line, Billing Status, Client Segment, Region, Month, and Year in one click.Accounting Firm Revenue Dashboard in Google Sheets
- 5 dedicated analysis pages — Overview, Revenue, Workload, Clients, and Search — each purpose-built for a distinct stakeholder need.Accounting Firm Revenue Dashboard in Google Sheets
- Revenue page breaking down billing performance by Billing Status, Service Line, Client Segment, and Month — exactly 4 charts for trend and mix analysis.
- Workload page tracking Billable Hours by Month, Service Line, Staff Member, and Partner — for capacity planning and utilization analysis.Accounting Firm Revenue Dashboard in Google Sheets
- Clients page combining Revenue and WIP by Client Segment, Revenue by Region, Revenue by Client, and Billing Status by Client Segment for portfolio-level risk insights.
- Search tab — pick any Engagement ID from a dropdown and instantly see all 13 fields for that engagement: Date, Service Line, Client Segment, Partner, Staff Member, Client Name, Revenue, Billable Hours, WIP Amount, Billing Status, Region, Month, and Year.Accounting Firm Revenue Dashboard in Google Sheets
- Structured Data Sheet — add engagement records in the same column format and all 5 pages update automatically. Ships with sample data for immediate exploration.Accounting Firm Revenue Dashboard in Google Sheets
Dashboard Pages Explanation
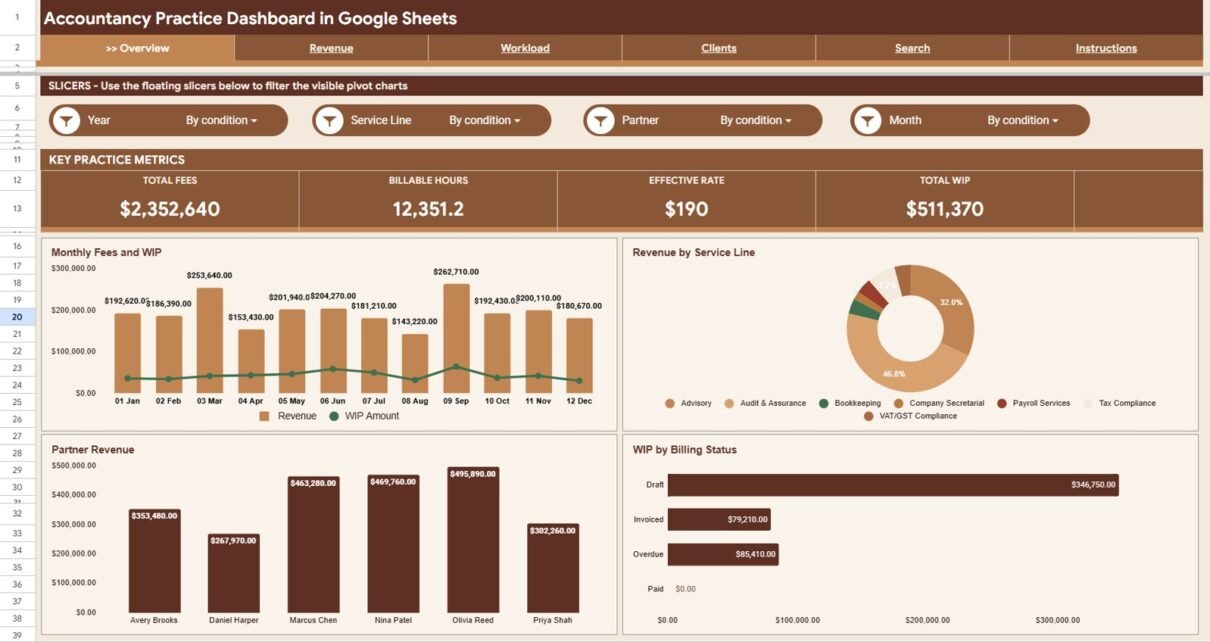
Page 1: Overview
The Overview page is the executive summary of the dashboard. Four KPI cards at the top display Total Fees (total revenue billed across all engagements), Billable Hours (total hours logged by all staff and partners), Effective Rate (revenue per billable hour, calculated automatically), and Total WIP (aggregate work-in-progress value across all unbilled and partially billed engagements). Multiple slicers below the cards let users filter by Partner, Service Line, Billing Status, Client Segment, Region, Month, and Year — and every chart on the page responds instantly. The four overview charts are Revenue and WIP Amount by Month (comparing billing trends against WIP accumulation), Revenue by Service Line (practice area contribution to total fees), Revenue by Partner (individual partner billing performance), and WIP by Billing Status (unbilled, partially billed, and at-risk work exposure).Accounting Firm Revenue Dashboard in Google Sheets
Page 2: Revenue
The Revenue page delivers deeper billing analysis without the slicer clutter of the Overview. It shows Revenue by Billing Status (to see the split between fully billed, unbilled, and partially billed work), Revenue by Service Line (audit, tax, advisory, and other practice area contributions), Revenue by Client Segment (enterprise, mid-market, and SME fee mix), and Revenue by Month (a monthly trend of fees earned across the year). Practice managers use this page to identify which client segments and months drive the most revenue and where collection risk is concentrated.Accounting Firm Revenue Dashboard in Google Sheets
Revenue Page
Page 3: Workload
The Workload page tracks billable capacity and staff utilization across four dimensions: Billable Hours by Month (capacity trend to identify peak and slow periods), Hours by Service Line (workload distribution across audit, tax, and advisory), Billable Hours by Staff (individual contributor output to spot overloaded team members), and Billable Hours by Partner (partner-level delivery volume for supervision and planning). Practice managers use this page weekly to catch capacity pressure before it impacts quality and client satisfaction.Accounting Firm Revenue Dashboard in Google Sheets
Workload Page
Page 4: Clients
The Clients page gives practice managers and partners a portfolio-level view of revenue and WIP risk by client dimension. Revenue and WIP Amount by Client Segment shows enterprise vs. mid-market vs. SME exposure side by side. Revenue by Region identifies geographic concentration. Revenue by Client surfaces top client concentration risk — flagging when two or three clients represent an outsized share of total fees. Billing Status by Client Segment shows which segments carry the highest unbilled or overdue balances, informing collections outreach prioritization.
Clients Page
Page 5: Search
The Search tab eliminates the need to scroll through the Data Sheet when answering partner queries or preparing client-specific reports. Select any Engagement ID from the dropdown and the tab instantly displays all 13 fields for that engagement: Date, Service Line, Client Segment, Partner, Staff Member, Client Name, Revenue, Billable Hours, WIP Amount, Billing Status, Region, Month, and Year. No filtering, no VLOOKUP formulas, no manual search — the result appears in one click.Accounting Firm Revenue Dashboard in Google Sheets
Search Tab
Data Sheet Tab
The Data Sheet is the input layer that powers all five analysis pages. Each row represents one engagement record with columns for Engagement ID, Date, Service Line, Client Segment, Partner, Staff Member, Client Name, Revenue, Billable Hours, WIP Amount, Billing Status, Region, Month, and Year. Add records in the same column format and every chart, KPI card, and Search tab lookup updates automatically. The template ships with sample data so you can explore all charts before entering your firm’s actual records.Accounting Firm Revenue Dashboard in Google Sheets
Data Sheet Tab
Accounting Firm Revenue and WIP Dashboard in Google Sheets vs. Microsoft Excel Dashboard vs. Paid Practice Management Software — Feature Comparison
| Feature | Accounting Firm Revenue & WIP Dashboard (Google Sheets) | Microsoft Excel Dashboard | Paid Practice Management (Karbon / Clio / CCH) |
|---|---|---|---|
| Cost | $9.99 one-time | $14.99–$29.99 one-time | $49–$200+/user/month |
| Platform | Google Sheets (browser, mobile, any OS) | Microsoft Excel (desktop license required) | Cloud SaaS — subscription lock-in |
| Setup Time | Under 10 minutes | 15–30 minutes | Weeks to months + IT support |
| Real-Time Collaboration | Yes — built into Google Sheets | Limited (OneDrive co-authoring) | Yes |
| Dashboard Pages | 5: Overview, Revenue, Workload, Clients, Search | Manual setup required | Yes (rigid, non-customizable layouts) |
| Slicer Filtering | Yes — multiple slicers on Overview | Manual slicer setup | Limited filtering options |
| Engagement ID Lookup | Yes — dedicated Search tab | Not included | Yes |
| Year-1 Cost at 5 Users | $9.99 total | $14.99 + Excel licenses | $2,940–$12,000+ |
| IT Setup Required | No — self-service | No | Yes — admin and implementation required |
For accounting firms and professional services practices that need multi-page revenue, WIP, and workload analytics without paying $49+/user/month for practice management software, the Accounting Firm Revenue and WIP Dashboard in Google Sheets sits in the sweet spot.
Who Should Use This Template
Perfect for:
- Accounting firms, CPA practices, and professional services firms that track revenue, billable hours, WIP, and billing status across multiple engagements
- Practice managers and partners who need monthly visibility into fee performance, staff utilization, and client portfolio concentration risk
- Finance operations teams replacing manually compiled billing spreadsheets with a structured, auto-updating Google Sheets dashboard
- Small and mid-size accounting firms (5–200 staff) who want professional revenue and WIP analytics without Karbon, Clio, or CCH subscription costs
- Finance consultants managing multiple client accounts across service lines and geographic regions
Not a fit if:
- You need direct API integration with time-tracking systems like Xero Practice Manager, MYOB, or QuickBooks Time
- Your firm processes 10,000+ monthly engagement records and needs fully automated data feeds from practice management software
- You require SOC 2 audit trails, field-level access control, or multi-entity consolidation across legal entities
Real-World Use Cases
👉 Click here to Purchase the Accounting Firm Revenue and WIP Dashboard in Google Sheets
Rajiv manages a 40-person CPA firm in Mumbai. Each month, his team exports engagement data from their billing system and pastes it into the Data Sheet. The Overview page’s slicers let him filter by Partner in seconds, and the WIP by Billing Status chart immediately flags engagements that have been unbilled for more than 60 days. Before this dashboard, that analysis took a half-day in Excel. Now it takes under 5 minutes, and partners review their numbers before the Monday morning meeting.
Sarah is the practice manager at a boutique advisory firm in London. She uses the Workload page every Friday to check Billable Hours by Staff against weekly targets. The Revenue by Client chart on the Clients page revealed that two clients represented 61% of total fees — a concentration risk she hadn’t quantified before. She now tracks client diversification as a formal quarterly KPI reported to the managing partner.
Carlos runs a regional tax and audit practice in Texas with three partners. Each partner has view-only access to the Google Sheets file and checks their individual revenue on the Revenue by Partner chart. They use the Search tab to pull full engagement details before client calls — replacing a weekly manually compiled PDF summary that was always 3 days out of date by the time it reached the partners.
Advantages of the Accounting Firm Revenue and WIP Dashboard in Google Sheets
One-time cost replaces recurring SaaS: $9.99 once versus $49–$200 per user per month for Karbon, Clio, or CCH practice management platforms. A 5-person team saves $2,940–$12,000 in the first year alone.Accounting Firm Revenue Dashboard in Google Sheets
5 dedicated pages for every stakeholder: Overview for partners, Revenue for billing managers, Workload for capacity planners, Clients for portfolio risk review, and Search for engagement-level lookups — each page purpose-built so nobody has to filter the data sheet manually.Accounting Firm Revenue Dashboard in Google Sheets
Slicer-powered filtering on the Overview: Apply Partner, Service Line, Billing Status, Client Segment, Region, Month, and Year filters simultaneously and every chart responds instantly — no PivotTable refresh or formula recalculation required.
Real-time collaboration: Share the file with all partners and the finance team simultaneously. Changes to the Data Sheet propagate to every chart and KPI card instantly, with no version control conflicts.
Structured Engagement ID lookup: The Search tab eliminates the most time-consuming part of engagement-level reporting — scrolling through the raw data sheet to answer a specific partner query takes one dropdown selection instead of manual filtering.Accounting Firm Revenue Dashboard in Google Sheets
Opportunities for Improvement
👉 Click here to Purchase the Accounting Firm Revenue and WIP Dashboard in Google Sheets
- Direct time-tracking integration: Pair with Google Apps Script to pull data from Toggl, Harvest, or Clockify via API, eliminating the monthly manual paste step.
- Automated WIP aging alerts: Add Apps Script rules to email partners when an engagement’s WIP has been unbilled for more than 30, 60, or 90 days — a common trigger for write-off risk.
- Multi-year comparison: Extend the Data Sheet with an additional Year filter to enable year-over-year revenue and hours comparisons across the same client segments and partners.
- Multi-currency support: Add a GOOGLEFINANCE-based currency conversion column for firms billing across multiple countries and currencies.Accounting Firm Revenue Dashboard in Google Sheets
Best Practices
Enter engagement records within 24 hours of work completion to keep WIP balances accurate and avoid month-end reconciliation backlogs that distort the WIP by Billing Status chart.Accounting Firm Revenue Dashboard in Google Sheets
Use a consistent Engagement ID format (e.g., ENG-2026-001) across your billing system and the Data Sheet so the Search tab dropdown always returns unambiguous results.Accounting Firm Revenue Dashboard in Google Sheets
Review the Workload page at least weekly during busy season — the Billable Hours by Staff chart usually signals capacity pressure 2–3 weeks before it shows up in client satisfaction scores.Accounting Firm Revenue Dashboard in Google Sheets
Set the Billing Status column values consistently (Billed, Unbilled, Partially Billed, Written Off) across all records so the WIP by Billing Status chart accurately reflects your unbilled exposure at any point in time.
Share the dashboard as view-only with partners and edit-access with the finance administrator to maintain data integrity — Google Sheets’ sharing and permissions guide walks through this setup in minutes.Accounting Firm Revenue Dashboard in Google Sheets
Explore Relevant Templates
🔸 Receipt Template in Google Sheets — Print-ready receipts with 8 KPI cards and daily Cash/Card/UPI/Check reconciliation for smaller billing operations.
🔸 Billing Accuracy KPI Dashboard in Google Sheets — Track billing KPIs with MTD/YTD comparisons, 12-month trend charts, and LTB/UTB conditional formatting.
🔸 Client Billing & Invoice Management Dashboard in Google Sheets — Invoice tracking with payment status, billing cycle analysis, and account manager performance.
🔸 Employment Law Services Dashboard in Excel — Revenue, billable hours, and workload tracking for legal practice areas in Excel.
🔸 Browse all Google Sheets Dashboards on NextGenTemplates.
Frequently Asked Questions
👉 Click here to Purchase the Accounting Firm Revenue and WIP Dashboard in Google Sheets
What pages are included in the Accounting Firm Revenue and WIP Dashboard in Google Sheets?
The Accounting Firm Revenue and WIP Dashboard includes 6 sheet tabs: Overview (4 KPI cards, 4 charts, multiple slicers), Revenue (4 revenue analysis charts), Workload (4 billable hours charts), Clients (4 client portfolio charts), Search (Engagement ID lookup), and Data Sheet (structured data entry). All tabs update automatically when engagement records are added to the Data Sheet.Accounting Firm Revenue Dashboard in Google Sheets
What KPI cards are on the Overview page?
The Overview page of the Accounting Firm Revenue and WIP Dashboard displays 4 headline KPI cards: Total Fees (total revenue billed across all engagements), Billable Hours (total hours logged by all staff and partners), Effective Rate (revenue per billable hour, calculated automatically from Total Fees and Billable Hours), and Total WIP (aggregate work-in-progress value across all unbilled and partially billed engagements in the Data Sheet).Accounting Firm Revenue Dashboard in Google Sheets
How does the Search tab work in the dashboard?
The Search tab contains a dropdown list populated with all Engagement IDs from the Data Sheet. Select any Engagement ID and the tab instantly displays all 13 fields for that record: Date, Service Line, Client Segment, Partner, Staff Member, Client Name, Revenue, Billable Hours, WIP Amount, Billing Status, Region, Month, and Year — with no manual filtering or formula editing required.
Can the slicers on the Overview page be customized?
Yes. The slicers are standard Google Sheets slicers connected to the pivot tables powering the charts. You can modify slicer labels, add slicer fields based on additional columns in the Data Sheet, or remove slicers that don’t match your firm’s reporting dimensions. No Google Apps Script or coding is required for these adjustments.Accounting Firm Revenue Dashboard in Google Sheets
How does this dashboard compare to Karbon or Clio practice management software?
Karbon and Clio cost $49–$200 per user per month and typically require weeks of implementation plus IT support. The Accounting Firm Revenue and WIP Dashboard in Google Sheets costs $9.99 one-time with no recurring fees. It does not integrate directly with time-tracking systems — engagement data entry is manual — but for firms with 5–200 staff, it delivers the same revenue, WIP, and workload visibility at a fraction of the annual cost.Accounting Firm Revenue Dashboard in Google Sheets
Does this dashboard work for law firms or consulting practices, not just accounting firms?
Yes. The dashboard structure — Revenue by Service Line, Billable Hours by Staff, WIP by Billing Status, Revenue by Client Segment — maps directly to any time-based billing business. Law firms, management consulting practices, engineering firms, and advisory boutiques all use the same engagement-level data model. Replace the sample Service Line and Client Segment labels in the Data Sheet with your own and the entire dashboard reframes to your practice.Accounting Firm Revenue Dashboard in Google Sheets
Is this dashboard a one-time purchase?
Yes. The Accounting Firm Revenue and WIP Dashboard in Google Sheets is $9.99 one-time, instant download, no subscription, no per-user fees, and lifetime access. Free updates are included whenever the template is revised.
About the Author
Built by PK — Microsoft Certified Professional with 15+ years of Excel, Google Sheets, and Power BI experience. Founder of NextGenTemplates, reaching 300K+ subscribers across YouTube channels (@PK-AnExcelExpert, @NextGenTemplates, @NeoTechNavigators). Every template is hand-built and tested before release.
Conclusion
The Accounting Firm Revenue and WIP Dashboard in Google Sheets gives accounting partners, practice managers, and finance teams a 5-page analytics platform covering Total Fees, Billable Hours, Effective Rate, and Total WIP with slicer-driven filtering, dedicated Revenue, Workload, and Client pages, and an Engagement ID lookup tab — all at a $9.99 one-time cost versus $49–$200 per user per month for traditional practice management software.
👉 Click here to Purchase the Accounting Firm Revenue and WIP Dashboard in Google Sheets
✅ Instant download · One-time payment · No subscription · Lifetime access
🎥 Visit our YouTube channel for step-by-step video tutorials: Youtube.com/@NeoTechNavigators
📅 Last updated: June 2026