In today’s competitive digital marketing world, every dollar spent on advertising must deliver measurable results. However, many businesses struggle to track spending, optimize campaigns, and understand whether their ad budget is actually generating a positive return.Ad Spend Efficiency KPI Dashboard in Google Sheets
To solve these challenges, a well-structured Ad Spend Efficiency KPI Dashboard in Google Sheets becomes a powerful strategic tool. It helps you measure, analyze, and optimize the financial performance of your ad campaigns using real-time numbers.Ad Spend Efficiency KPI Dashboard in Google Sheets
In this blog post, we will explore the core features, key KPIs, advantages, opportunities, dashboard structure, and how this Google Sheets-based template helps businesses take complete control of their marketing budget.Ad Spend Efficiency KPI Dashboard in Google Sheets
What Is an Ad Spend Efficiency KPI Dashboard?
An Ad Spend Efficiency KPI Dashboard is a centralized reporting tool that tracks your advertising performance across multiple channels. It compares your actual monthly and yearly performance against set targets and previous year results.
With this dashboard in Google Sheets, marketing teams can:
-
Analyze campaign performance
-
Track ROI and cost metrics
-
Identify budget waste
-
Monitor trends
-
Make data-driven decisions to boost efficiency
It’s a ready-to-use template with dropdown selections, automated calculations, conditional formatting, and KPI definitions.
Dashboard Structure
Click to Buy Ad Spend Efficiency KPI Dashboard in Google Sheets
This dashboard contains 6 fully automated worksheet tabs, each playing a specific role.
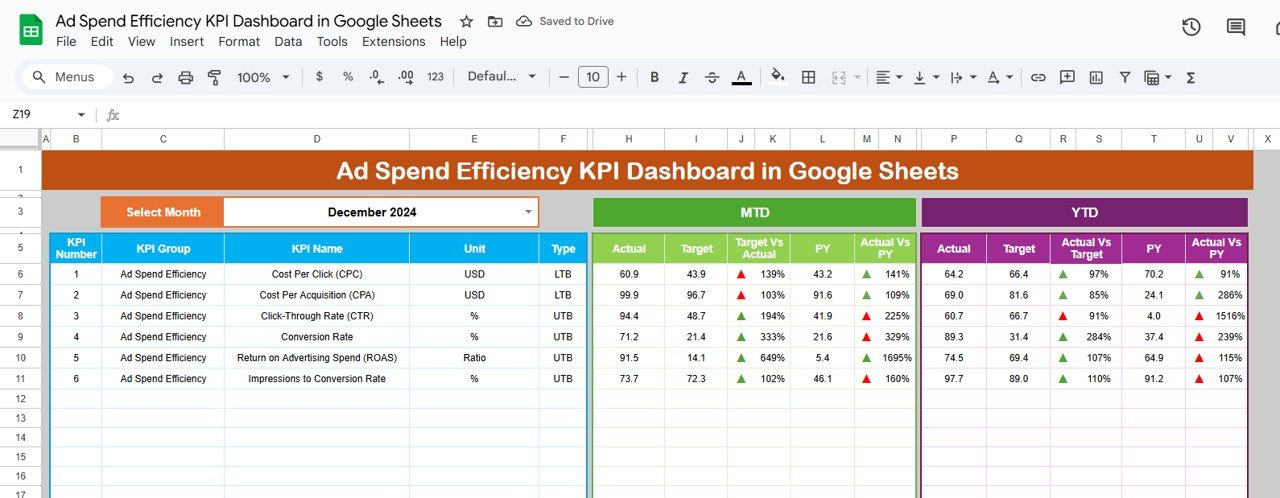
1. Dashboard Sheet (Main Page)
This is the central performance page of the dashboard.
Key Features
-
Select any month from dropdown (Cell D3)
-
Automatically refreshes all KPI numbers
-
Shows MTD (Month to Date) and YTD (Year to Date) performance
Displays:
- Actuals
- Targets
- Previous Year (PY) data
- Target vs Actual comparison
- PY vs Actual comparison
Conditional formatting arrows to show:
- Performance improvement
- Performance decline
This page gives a complete 360° view of your ad performance for the selected month.
Click to Buy Ad Spend Efficiency KPI Dashboard in Google Sheets
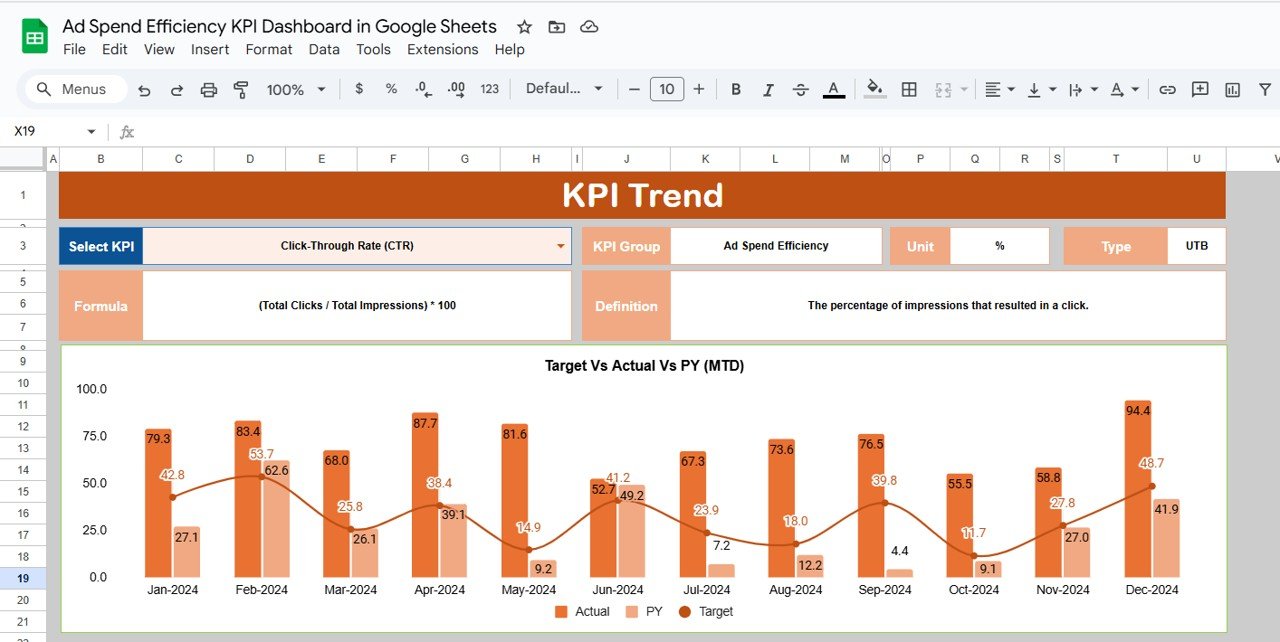
2. KPI Trend Sheet
This sheet helps you understand how each KPI is defined and calculated.
Here you will find:
-
KPI Name
-
KPI Group
-
Unit of Measurement
-
KPI Type (Lower-the-better or Upper-the-better)
-
Formula to aggregate KPI
-
Text Definition
This helps teams and stakeholders understand the logic behind each KPI.
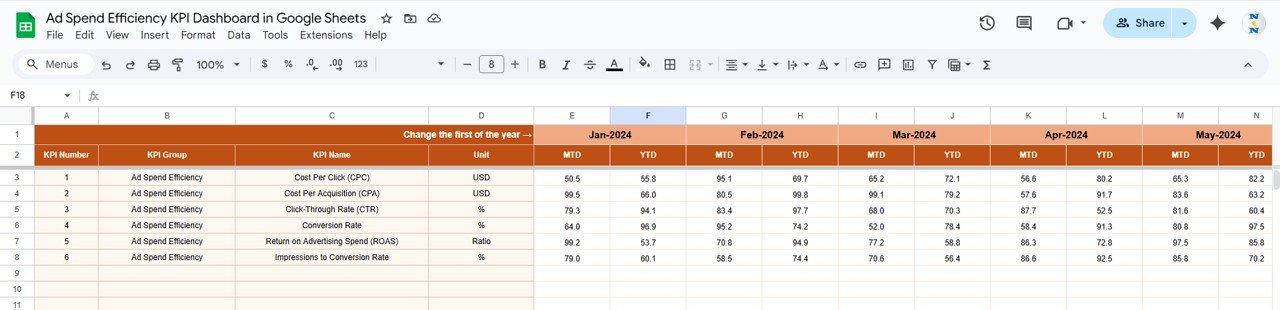
3. Actual Number Sheet
-
Enter actual monthly MTD and YTD values here.
-
Change the month at Cell E1 to update input columns.
-
Ensures accurate actual data entry for all KPIs.
Click to Buy Ad Spend Efficiency KPI Dashboard in Google Sheets
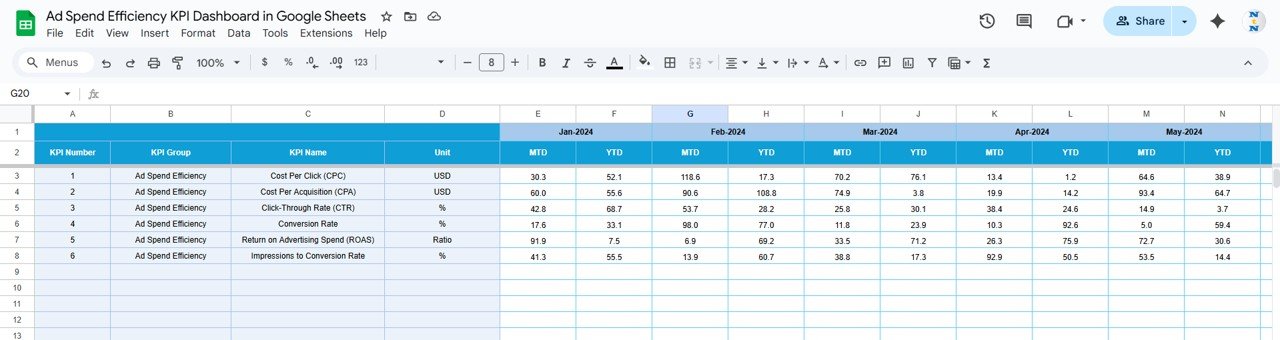
4. Target Sheet
-
Input the target values for each KPI:
-
MTD Target
-
YTD Target
-
-
Helps the dashboard compare actual performance against standards.
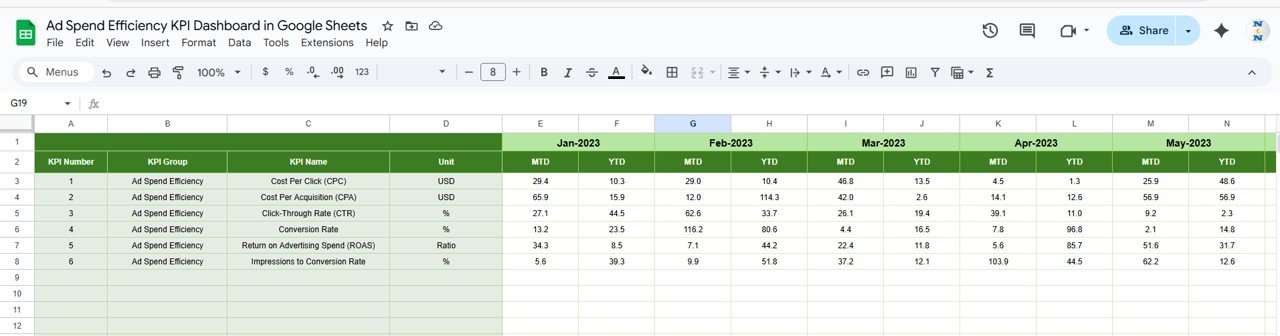
5. Previous Year Number Sheet
-
Enter previous year data in the same structure as current year.
-
Useful for YoY comparison.
Click to Buy Ad Spend Efficiency KPI Dashboard in Google Sheets
6. KPI Definition Sheet
Here you will store the master table:
-
KPI Name
-
KPI Group
-
Unit
-
Formula
-
KPI Definition
This acts as a single source of truth for all metrics.

Advantages of the Ad Spend Efficiency Dashboard
Click to Buy Ad Spend Efficiency KPI Dashboard in Google Sheets
1. Centralized KPI Monitoring
Track all important performance indicators in one place.
2. Improves Decision Making
Helps identify trends, inefficiencies, and opportunities instantly.
3. Saves Time
Automated formulas reduce manual reporting efforts significantly.
4. Enhances Budget Control
Track variance, overspending, and ROI in real time.
5. Ensures Transparency
Clear definitions help align marketing, finance, and leadership teams.
6. Data-Driven Optimization
Improve campaigns based on numbers, not assumptions.
Opportunities Created by Using This Dashboard
1. Identify High-Performing Channels
You can focus more budget on channels delivering best ROI.
2. Reduce Wasted Ad Spend
Spot campaigns with high CPL, CPC, or CAC immediately.
3. Improve Marketing Forecasting
YTD and MTD trends help in long-term planning.
4. Build Team Accountability
Targets drive consistent team performance.
5. Optimize Budget Allocation
Shift resources from low-performing to high-performing areas.
6. Enhance Customer Acquisition Strategy
Detailed CAC and lead metrics help refine your funnel.
Why Use Google Sheets for Ad Spend Reporting?
Click to Buy Ad Spend Efficiency KPI Dashboard in Google Sheets
-
Cloud-based and accessible from anywhere
-
Real-time collaboration
-
Easy to customize
-
Compatible with marketing platforms
-
No expensive tools required
-
Simple automation using formulas & dashboards
Final Thoughts
Click to Buy Ad Spend Efficiency KPI Dashboard in Google Sheets
A well-designed Ad Spend Efficiency KPI Dashboard in Google Sheets enables teams to control their marketing budget, boost performance, and improve financial decision-making. With its automated calculations, visual insights, KPI definitions, and comparisons against targets and previous years, this dashboard provides everything needed to optimize advertising efforts.
Visit our YouTube channel to learn step-by-step video tutorials
Youtube.com/@NeotechNavigators
Watch the step-by-step video Demo:
Click to Buy Ad Spend Efficiency KPI Dashboard in Google Sheets