In the fast-paced and data-driven aerospace industry, tracking key performance indicators (KPIs) is essential for maintaining operational efficiency, optimizing performance, and driving informed decisions. A well-organized KPI dashboard can provide clear insights into critical aspects of aerospace operations. Google Sheets offers a flexible, cloud-based platform to track and analyze these KPIs seamlessly. In this article, we’ll walk you through the creation of an Aerospace KPI Dashboard in Google Sheets, including its key features, the most important KPIs, and how to make the most out of this tool.
What is an Aerospace KPI Dashboard?
An Aerospace KPI Dashboard is a tool designed to monitor and visualize the key metrics that are crucial for the performance of the aerospace industry. These KPIs cover a range of operational areas, from aircraft maintenance and flight schedules to fuel consumption and safety compliance. With a Google Sheets-based dashboard, aerospace professionals can easily input data, track trends, and make timely decisions based on real-time information.
Key Features of the Aerospace KPI Dashboard in Google Sheets
The Aerospace KPI Dashboard template in Google Sheets consists of several key features that make it a powerful tool for managing aerospace operations effectively:
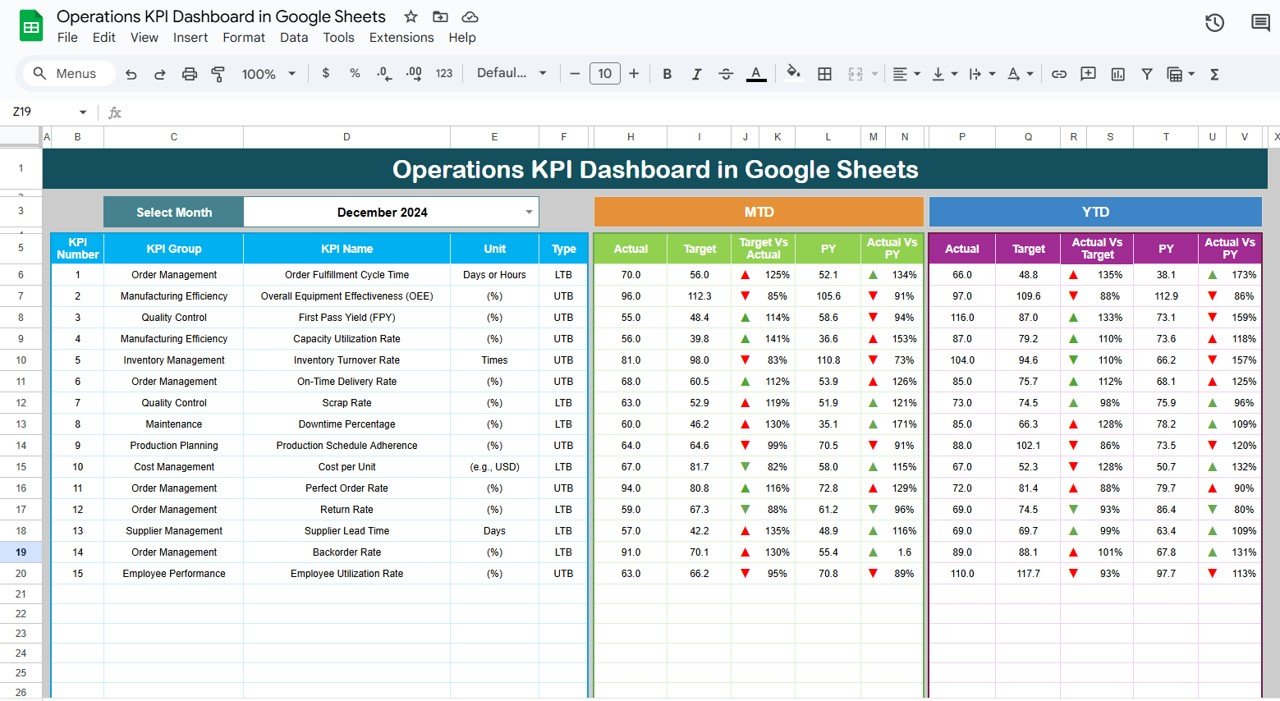
Dashboard Sheet Tab
This is the main sheet that aggregates all the KPIs. On this tab, you can select the month from a dropdown list in cell D3. Once you choose a month, the entire dashboard updates to reflect the current month’s data. Here, the following information is displayed:
- MTD (Month-to-Date) Actuals, Targets, and Previous Year (PY) data.
- Target vs. Actuals comparisons, with visual conditional formatting (up/down arrows).
- YTD (Year-to-Date) Actuals, Targets, and PY data.
- Visual cues for performance trends, making it easier to track progress.

Click to buy Aerospace KPI Dashboard in Google Sheets
KPI Trend Sheet Tab
This sheet allows you to select a specific KPI from the dropdown menu in cell C3. For each KPI, the following information is displayed:
- KPI Group
- Unit of Measurement
- Type of KPI (whether lower is better or upper is better)
- Formula for calculating the KPI
- A concise definition of the KPI to understand its significance.

Click to buy Aerospace KPI Dashboard in Google Sheets
Actual Number Sheet Tab
On this tab, you can input the actual performance numbers for YTD and MTD for a specific month. Simply change the month in cell E1 to update the data entry fields. The flexibility to adjust the month ensures that the dashboard is always up-to-date.

Click to buy Aerospace KPI Dashboard in Google Sheets
Target Sheet Tab
In this sheet, you can input the target numbers for each KPI for both MTD and YTD. This data is crucial for comparing actual performance against predefined goals.

Previous Year Number Sheet Tab
This tab allows you to enter the performance numbers for the previous year. By comparing this data with the current year’s performance, you can assess the improvements or setbacks in key areas.

KPI Definition Sheet Tab
This tab holds all the necessary information about each KPI, including:
- KPI Name
- KPI Group
- Unit of Measurement
- Formula for calculating the KPI
- A detailed definition to provide context for each metric.

Advantages of the Aerospace KPI Dashboard in Google Sheets
-
Centralized Data Management: All relevant data is collected in one central location. This eliminates the need to search across multiple documents or systems, allowing for quick access to performance data.
-
Real-Time Data Updates: With Google Sheets, changes made to any tab are reflected instantly across all connected cells, ensuring that the dashboard always displays the most current data.
-
Customization Flexibility: Users can customize the template according to their specific operational needs. The ability to adjust targets, input values, and select KPIs makes the dashboard adaptable to various aerospace operations.
-
Ease of Access and Sharing: Being a cloud-based solution, Google Sheets makes it easy to share the dashboard with team members, stakeholders, or decision-makers. Collaboration is simple and efficient, with everyone working on the same data in real-time.
-
Data Visualization: The dashboard employs conditional formatting and visual cues (e.g., up/down arrows) that make it easier to interpret data trends. This can help stakeholders make informed decisions quickly.
Opportunity for Improvement in the Aerospace KPI Dashboard
Click to buy Aerospace KPI Dashboard in Google Sheets
While the Aerospace KPI Dashboard in Google Sheets is a powerful tool, there are always opportunities to enhance its functionality:
-
Automation through Google Scripts: By using Google Apps Script, you can automate certain functions, such as data entry, calculations, or even sending automated email alerts when a KPI falls below a threshold.
-
Integration with External Data Sources: For a more streamlined process, consider integrating the dashboard with external data sources like databases or cloud services. This can automate the updating of actual numbers, targets, and previous-year data without manual entry.
-
Advanced Data Analysis: Incorporating advanced analytics tools, such as trend lines, forecasting models, or predictive analysis, could improve the decision-making process and provide better insights into long-term trends.
-
Enhanced Visuals: Adding more interactive charts, graphs, and dashboards can help stakeholders visually interpret the data. You could integrate Google Data Studio for enhanced visualizations, allowing for more sophisticated reports and interactive insights.
Best Practices for Using the Aerospace KPI Dashboard
Click to buy Aerospace KPI Dashboard in Google Sheets
-
Regularly Update Actual Numbers: To ensure the dashboard reflects the most up-to-date information, input the actual numbers for MTD and YTD regularly. This should be done at least once a week or after every significant event, such as an aircraft’s maintenance.
-
Set Clear and Achievable Targets: Be sure that the targets entered in the “Target Sheet” are realistic and aligned with your organization’s strategic objectives. Unrealistic targets can skew the performance analysis.
-
Monitor KPI Trends Consistently: Use the KPI Trend Sheet regularly to spot trends early. This will help identify any areas that need immediate attention, whether it’s maintenance delays, safety compliance issues, or fuel efficiency problems.
-
Train Your Team: Ensure that everyone using the dashboard understands how to input data correctly, interpret the results, and take appropriate actions based on performance trends. Proper training will maximize the dashboard’s effectiveness.
-
Review Performance Quarterly: Regular reviews of your KPIs (at least once per quarter) will help keep the dashboard relevant. During these reviews, update targets, add new KPIs if needed, and ensure that all team members are aligned with the latest goals.
Conclusion
The Aerospace KPI Dashboard in Google Sheets is a powerful tool that allows aerospace professionals to monitor and track their operational performance with ease. With its easy-to-use interface and customizable features, it helps organizations track critical metrics, compare actual performance with targets, and make informed decisions. The ability to analyze data in real-time, combined with the flexibility of Google Sheets, makes this dashboard an essential tool for any aerospace organization looking to optimize its operations.
Frequently Asked Questions (FAQs)
1. What KPIs should be included in an Aerospace KPI Dashboard?
The KPIs should focus on key aspects such as aircraft maintenance, fuel efficiency, safety compliance, on-time performance, and customer satisfaction. Examples include “Aircraft Availability,” “Fuel Consumption per Flight,” and “Maintenance Downtime.”
2. How can I integrate external data into my Aerospace KPI Dashboard?
You can integrate external data by using Google Apps Script to pull data from other systems or APIs, or by using Google Sheets’ built-in import functions (e.g., IMPORTRANGE) to pull data from other sheets or spreadsheets.
3. How often should I update the data in the Aerospace KPI Dashboard?
For the most accurate and up-to-date insights, it is recommended to update the dashboard at least once a week. However, for critical KPIs like safety or maintenance, updates may need to be more frequent.
4. Can I add new KPIs to the dashboard?
Yes, the dashboard is fully customizable. You can easily add new KPIs by including them in the “KPI Definition Sheet” and updating the necessary formulas and calculations.
5. Is it possible to automate the data entry process?
Yes, you can automate the data entry process using Google Apps Script or by integrating the dashboard with external data sources to automatically populate the cells with real-time data.
Visit our YouTube channel to learn step-by-step video tutorials
Youtube.com/@NeotechNavigators
Watch the step-by-step video Demo: