In the world of agribusiness, staying on top of key performance indicators (KPIs) is essential to ensure operational efficiency, productivity, and profitability. The Agribusiness KPI Dashboard in Google Sheets is a powerful tool designed to help agribusinesses monitor critical metrics in real time. This ready-to-use template allows you to track a variety of KPIs, from production volumes to profitability, giving you the insights needed to optimize your agribusiness operations.
In this article, we will walk you through the Agribusiness KPI Dashboard in Google Sheets, its key features, and how to use it effectively to improve performance and make data-driven decisions.
What is the Agribusiness KPI Dashboard in Google Sheets?
The Agribusiness KPI Dashboard in Google Sheets is an interactive tool built in Google Sheets to track and visualize key performance indicators related to agribusiness activities. This dashboard allows you to input, track, and analyze data such as production volumes, revenues, efficiency, and sustainability metrics. It is designed to help agribusiness managers make informed decisions based on the most up-to-date data.
The dashboard contains six primary worksheets that give you a comprehensive view of your agribusiness performance.
Key Features of the Agribusiness KPI Dashboard in Google Sheets
The Agribusiness KPI Dashboard is divided into six essential worksheets, each of which provides a unique perspective on your operations:
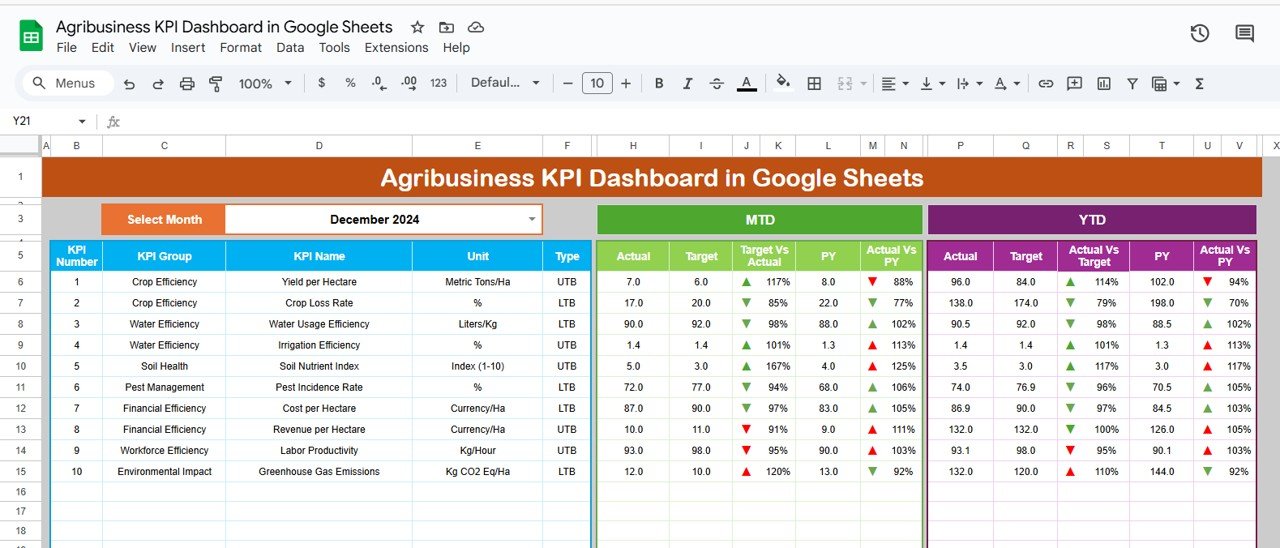
1. Dashboard Sheet Tab
The Dashboard Sheet is the main overview of all your KPIs. This sheet gives you a snapshot of your agribusiness performance, including:
Month-to-Date (MTD) and Year-to-Date (YTD) Metrics:
- The dashboard shows MTD and YTD actual data, target values, and previous year (PY) data.
- Conditional Formatting: Displays arrows to show whether the values are above or below the target and PY data.
Key Metrics Displayed:
- MTD Actual: Actual performance for the selected month.
- MTD Target: Target value for the selected month.
- PY vs Actual: Comparison of the current month’s data with the same period in the previous year.
- YTD Actual: Year-to-date performance for the current year.
- Target vs Actual (YTD): Shows how well the actual performance compares to the target YTD.
Click to buy Agribusiness KPI Dashboard in Google Sheets
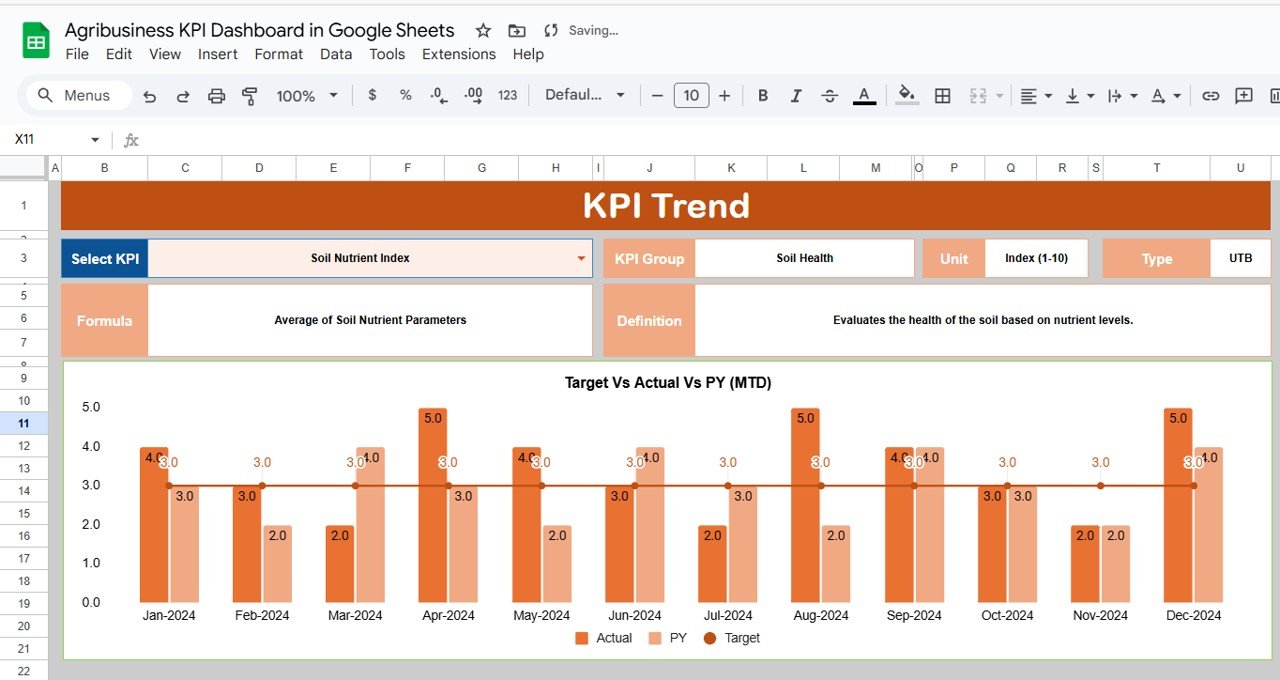
2. KPI Trend Sheet Tab
The KPI Trend Sheet enables you to track the trends of individual KPIs over time. It provides an in-depth look at how each KPI has evolved across different months.
KPI Selection Dropdown:
You can select a specific KPI from the dropdown in C3, and the sheet will display:
- KPI Group: The category of the KPI (e.g., production, financial, sustainability).
- Unit of KPI: The unit of measurement for the KPI (e.g., tons, dollars, percentage).
- Type of KPI: Whether the KPI is “Lower the Better” or “Upper the Better.”
- Formula of KPI: Describes how the KPI is calculated.
- Definition of KPI: Provides the meaning and relevance of each KPI.
Click to buy Agribusiness KPI Dashboard in Google Sheets
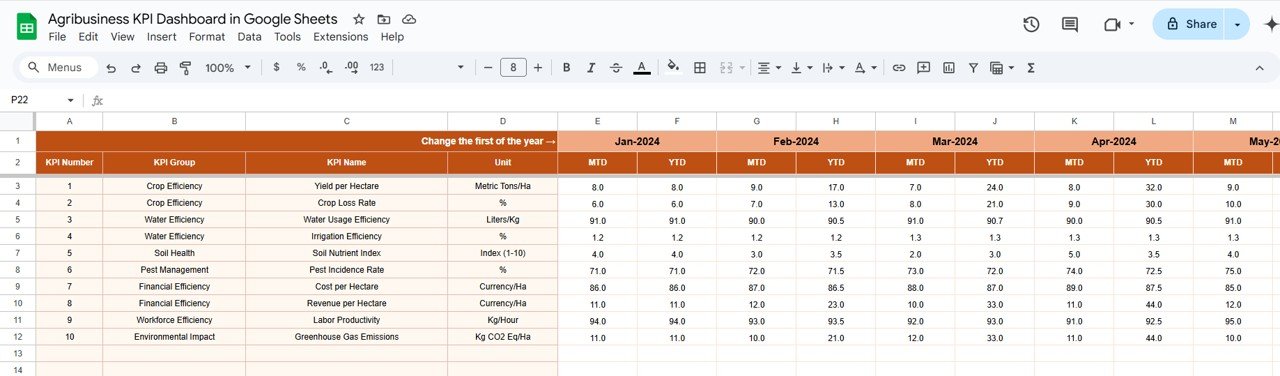
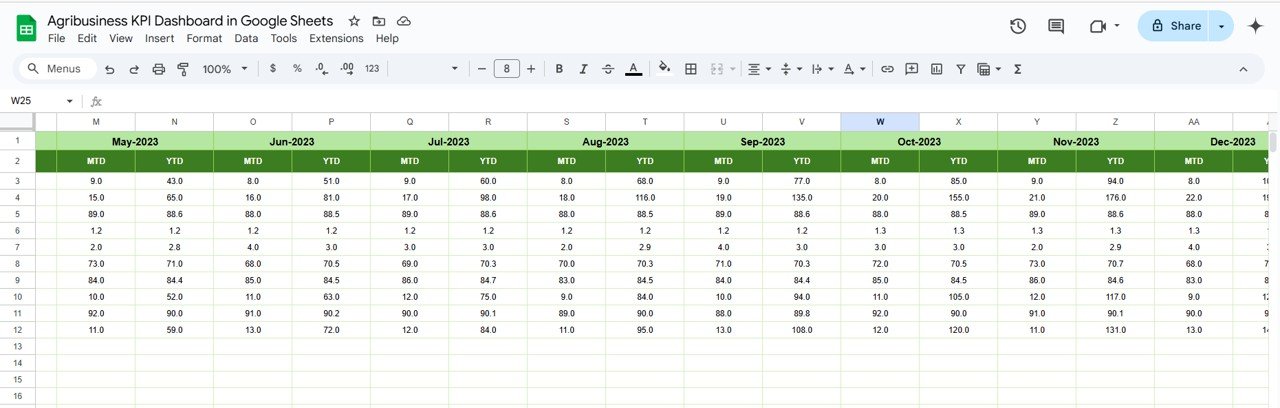
3. Actual Number Sheet Tab
In the Actual Number Sheet, you enter the actual performance data for MTD and YTD. The values you input here will automatically update the rest of the dashboard.
-
Monthly Data Entry:
You can input the actual data for each KPI based on the selected month (as indicated in E1), ensuring the dashboard reflects the most up-to-date numbers.
Click to buy Agribusiness KPI Dashboard in Google Sheets
4. Target Sheet Tab
The Target Sheet allows you to input the target figures for each KPI, both MTD and YTD. These targets are essential for comparing actual performance against expectations.
-
Target Data Entry:
You enter your target values for each KPI, ensuring that you have a clear benchmark for performance.
5. Previous Year Number Sheet Tab
The Previous Year Number Sheet helps you compare this year’s data with the same data from the previous year.
-
Previous Year Data Entry:
You input last year’s data for comparison, which allows you to track year-over-year progress.
Click to buy Agribusiness KPI Dashboard in Google Sheets
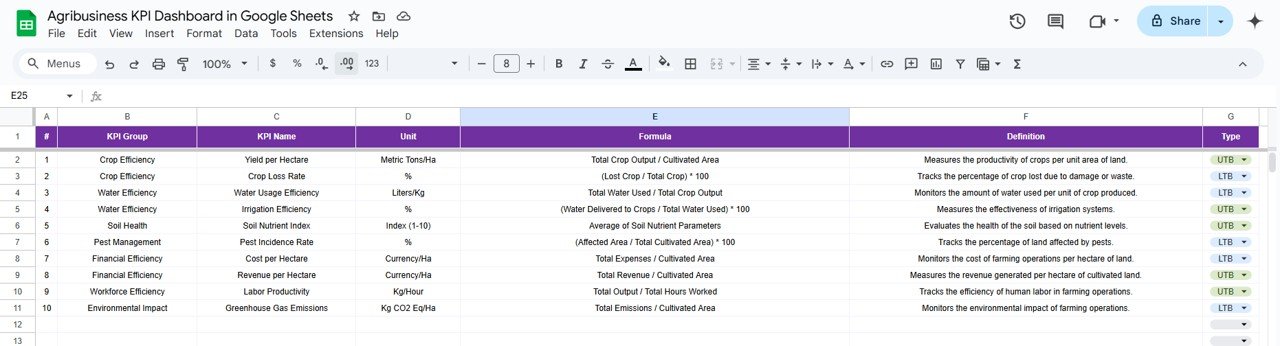
6. KPI Definition Sheet Tab
This sheet provides the detailed definitions for each KPI, offering a comprehensive understanding of the metrics you are tracking.
-
KPI Definitions:
In this sheet, you will define each KPI by entering the name, group, unit, formula, and a clear definition of what the KPI tracks.
How the Agribusiness KPI Dashboard Works
-
Data Entry: Enter the actual data for each KPI in the Actual Number Sheet. This sheet is essential for updating the dashboard.
-
Track Trends: Use the KPI Trend Sheet to track individual KPIs over time. This sheet allows you to analyze how each metric has evolved, helping to identify areas of improvement.
-
Comparison Against Targets: The Target Sheet allows you to set targets for each KPI, and the Dashboard Sheet will automatically compare actual performance against these targets, using color-coded indicators to show if you are on track.
-
Year-over-Year Comparisons: The Previous Year Number Sheet helps track your progress by comparing current-year performance against the same period in the previous year.
-
Review and Analyze: Regularly review the KPIs in the Dashboard Sheet to monitor progress and adjust strategies as needed.
Advantages of Using the Agribusiness KPI Dashboard
Click to buy Agribusiness KPI Dashboard in Google Sheets
-
Centralized Performance Tracking: The dashboard allows you to track all key metrics in one place, making it easier to monitor performance and make data-driven decisions.
-
Customizable and Flexible: You can easily modify the template to fit your specific agribusiness needs, whether you are tracking crop production, financials, or sustainability metrics.
-
Real-Time Data Updates: As you enter new data, the dashboard updates in real time, providing an accurate and up-to-date view of your agribusiness performance.
-
Visual Insights: The dashboard’s visual elements, such as charts and conditional formatting, make it easier to spot trends and areas for improvement at a glance.
-
Improved Decision-Making: By tracking and visualizing KPIs, the dashboard enables better decision-making, helping you optimize operations, reduce costs, and improve overall productivity.
Best Practices for Using the Agribusiness KPI Dashboard
-
Update Data Regularly: Make sure to input your actual data regularly to keep the dashboard accurate and up-to-date.
-
Monitor Trends Over Time: Use the KPI Trend Sheet to monitor performance over time, helping you identify patterns and areas that need attention.
-
Review Targets: Continuously review your targets and adjust them as needed to align with changing business goals and market conditions.
-
Leverage Insights for Continuous Improvement: Use the insights provided by the dashboard to improve processes, reduce waste, and enhance productivity across your agribusiness.
Frequently Asked Questions (FAQs)
Click to buy Agribusiness KPI Dashboard in Google Sheets
1. How do I update the Agribusiness KPI Dashboard?
Simply input the latest actual data for each KPI in the Actual Number Sheet, and the dashboard will automatically update.
2. Can I add more KPIs to the dashboard?
Yes, the template is customizable, and you can add new KPIs or modify existing ones to suit your needs.
3. How can I track performance over the long term?
Use the KPI Trend Sheet to analyze performance over multiple months or years, helping you monitor long-term progress.
4. How do I compare performance with last year’s data?
Enter last year’s data in the Previous Year Number Sheet to track year-over-year performance and identify areas of improvement.
Conclusion
The Agribusiness KPI Dashboard in Google Sheets is an invaluable tool for monitoring and improving the performance of your agribusiness operations. By providing real-time insights into key metrics, this dashboard helps agribusiness managers make informed decisions that drive efficiency, sustainability, and profitability. Whether you’re tracking production, revenue, or sustainability, this dashboard offers a comprehensive solution for managing your agribusiness performance.
Visit our YouTube channel to learn step-by-step video tutorials
Youtube.com/@NeotechNavigators