In the agricultural sector, tracking export performance is essential for ensuring growth, efficiency, and profitability. The Agricultural Exports KPI Dashboard in Google Sheets is a powerful tool that provides insights into key performance indicators (KPIs) related to agricultural exports. This ready-to-use dashboard allows users to monitor export performance, track goals, and make data-driven decisions to improve the overall export process.
What is the Agricultural Exports KPI Dashboard in Google Sheets?
The Agricultural Exports KPI Dashboard in Google Sheets is an interactive, customizable template designed to track various KPIs associated with agricultural exports. It helps organizations monitor performance against targets, track trends over time, and make informed decisions to boost export efficiency. This dashboard includes multiple worksheets to track actual values, set targets, and analyze historical performance.
Key Features of the Agricultural Exports KPI Dashboard
Click to buy Agricultural Exports KPI Dashboard in Google Sheets
The Agricultural Exports KPI Dashboard includes six distinct worksheets that provide a comprehensive view of export performance:
1. Dashboard Sheet Tab
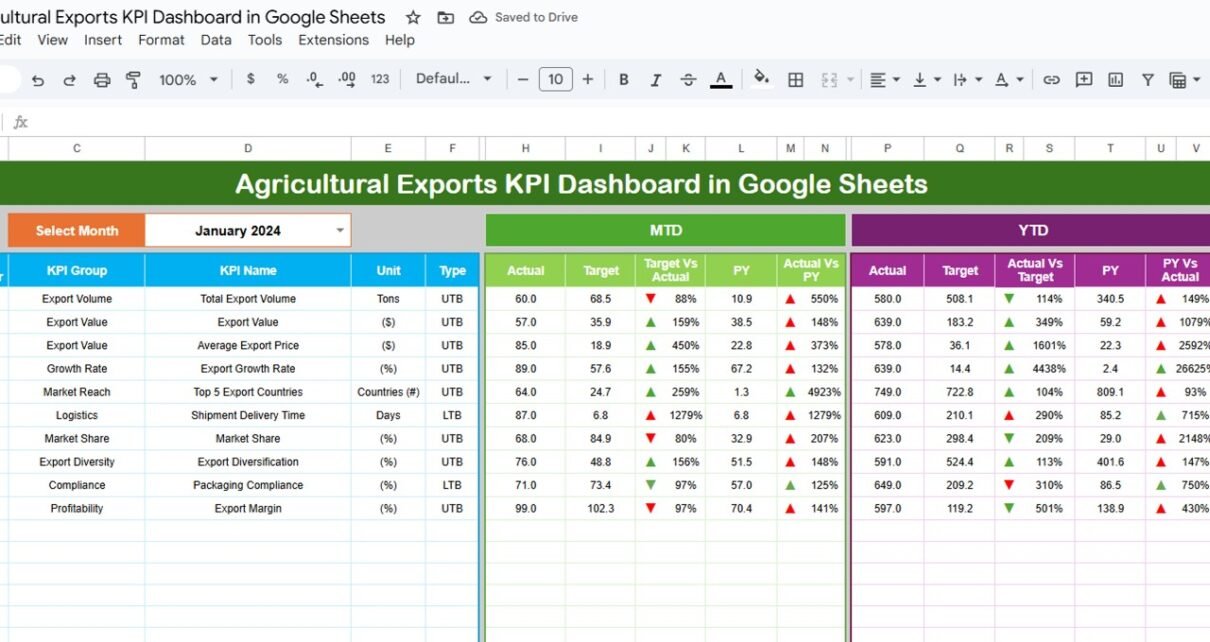
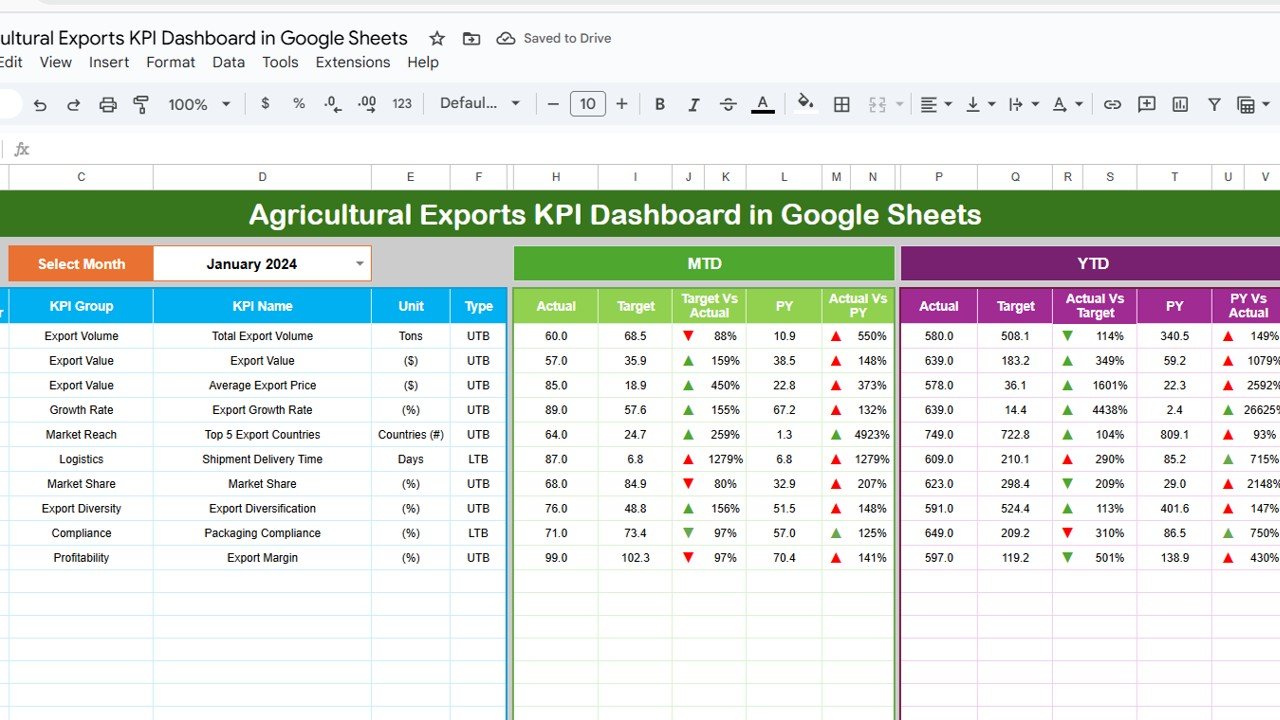
The Dashboard Sheet serves as the main page of the KPI dashboard, where all critical metrics are displayed. Key components of this sheet include:
-
MTD (Month-to-Date) and YTD (Year-to-Date) data, with comparisons to targets and previous year performance.
-
Target vs. Actual and Previous Year vs. Actual comparisons, shown with conditional formatting (up/down arrows) to visualize performance trends.
Charts: Visual representations of the KPIs, such as:
- Total Export Volume by Product Type
- Export Revenue vs Target
- Export Growth by Region
- Total Exports by Month
Click to buy Agricultural Exports KPI Dashboard in Google Sheets
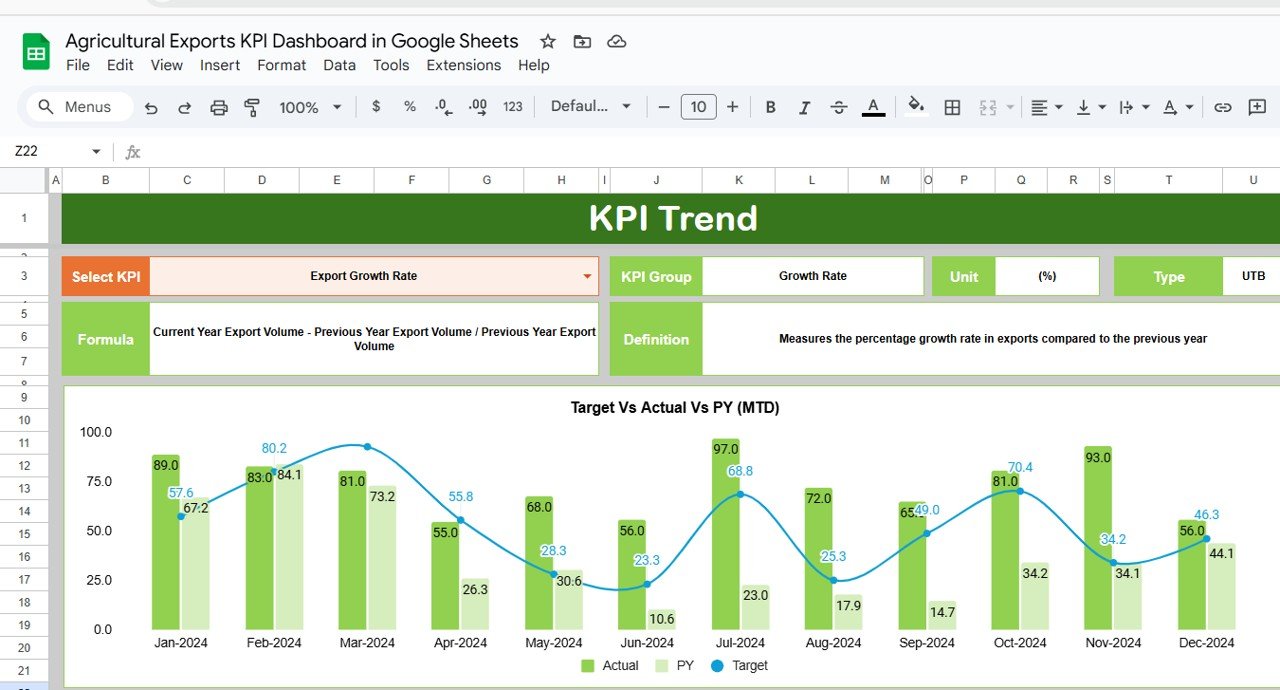
2. KPI Trend Sheet Tab
The KPI Trend sheet allows users to select individual KPIs from a dropdown list and track their performance over time. Key features of this sheet include:
-
KPI Group, Unit of KPI, and Type of KPI (whether “Lower the Better” or “Upper the Better”).
-
The Formula for each KPI to ensure proper calculation.
-
The Definition of each KPI for clarity and consistency.
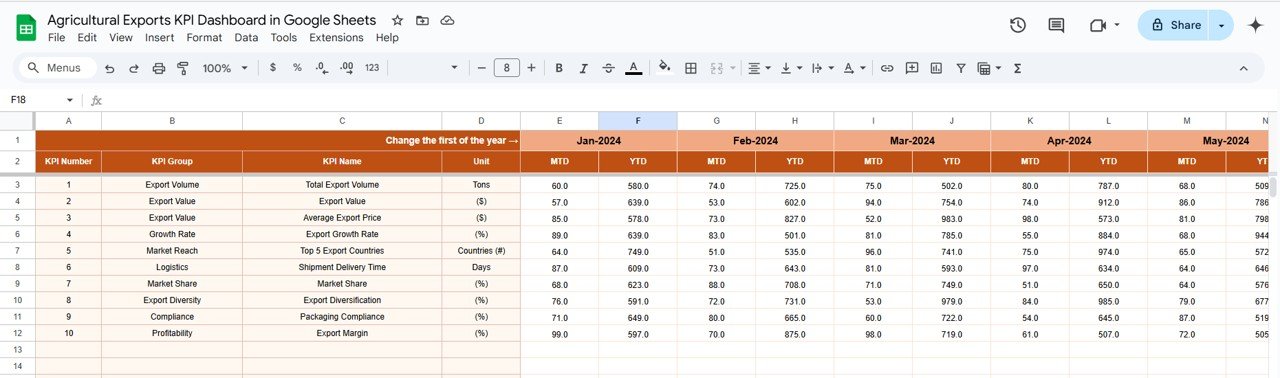
3. Actual Number Sheet Tab
In the Actual Number Sheet, users enter actual data for MTD and YTD performance for each KPI. This sheet allows users to update performance as new data becomes available. You can change the month from Range E1, and the dashboard will automatically adjust.
Click to buy Agricultural Exports KPI Dashboard in Google Sheets
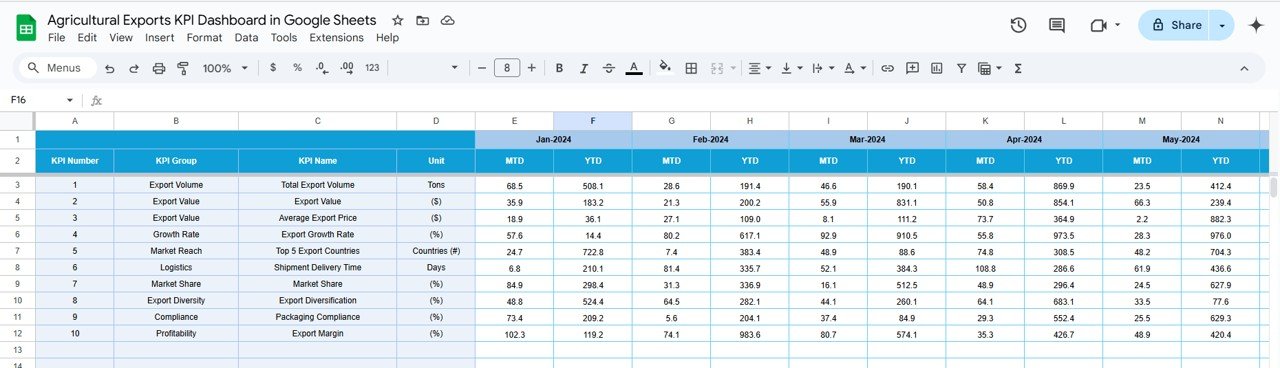
4. Target Sheet Tab
The Target Sheet is used to input target numbers for each KPI, both MTD and YTD, for a particular month. This data serves as a benchmark for evaluating actual performance.
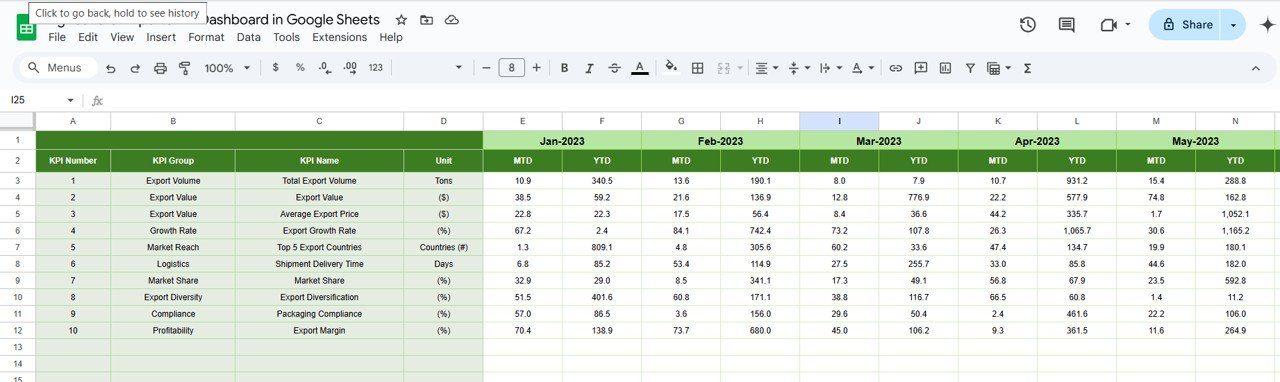
5. Previous Year Number Sheet Tab
The Previous Year Number Sheet allows users to input previous year data for each KPI, enabling comparisons with the current year to evaluate growth or decline in export performance.
Click to buy Agricultural Exports KPI Dashboard in Google Sheets
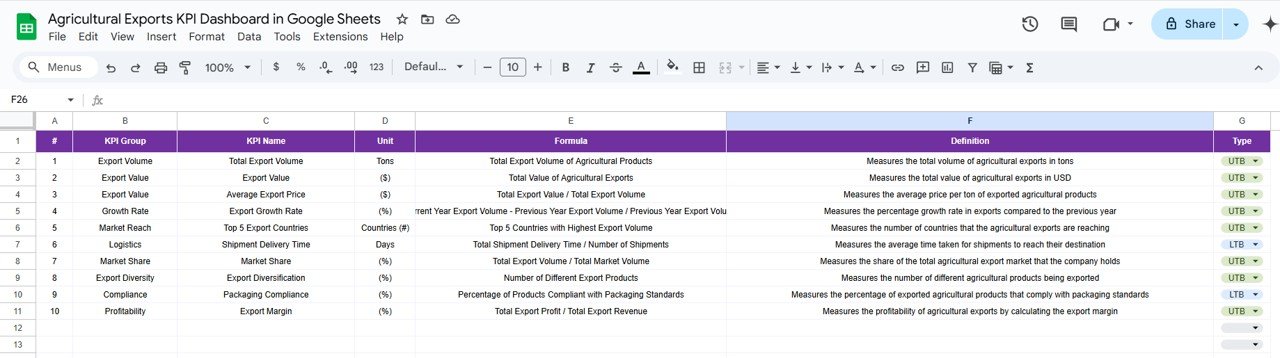
6. KPI Definition Sheet Tab
The KPI Definition Sheet is where users can define each KPI in detail. Key fields include:
-
KPI Name
-
KPI Group
-
Unit of Measure
-
Formula
-
Definition
This sheet ensures consistency in how each KPI is measured and tracked.
Click to buy Agricultural Exports KPI Dashboard in Google Sheets
Benefits of Using the Agricultural Exports KPI Dashboard
-
Data-Driven Decision Making: By tracking KPIs such as export volume, revenue, and claims rate, the dashboard helps agricultural export companies make better business decisions.
-
Monitor Performance: The Target vs. Actual and Previous Year vs. Actual comparisons provide real-time insights into how the company is performing against its goals and past performance.
-
Track Export Trends: By using visualizations like charts and graphs, users can quickly spot trends in export performance, helping them make adjustments where necessary.
-
Improved Accountability: The Responsible Person column ensures that specific individuals or teams are accountable for meeting targets and improving performance.
-
Regional Insights: The ability to analyze data by region and policy type helps businesses understand where to focus their efforts and optimize strategies for growth.
Best Practices for Using the Agricultural Exports KPI Dashboard
Click to buy Agricultural Exports KPI Dashboard in Google Sheets
-
Update Data Regularly: Make sure to update the dashboard regularly with the latest actual data for accurate performance tracking.
-
Review Key Metrics Frequently: Regularly review KPIs such as Export Revenue and Export Growth by Region to stay on top of market trends and identify areas for improvement.
-
Use the Trend Data: Leverage the KPI Trend Sheet to analyze historical performance and understand long-term trends in export growth.
-
Set Realistic Targets: Ensure that the targets for each KPI are challenging but achievable, and adjust them based on the latest data and market conditions.
-
Collaborate Across Teams: Share the dashboard with key stakeholders to ensure that all teams are aligned on goals and performance expectations.
Conclusion
The Agricultural Exports KPI Dashboard in Google Sheets is an essential tool for organizations in the agricultural export sector. By tracking KPIs like export volume, revenue, growth by region, and claims rate, businesses can make informed decisions, optimize their export processes, and drive growth. With its interactive features, real-time data updates, and customizable nature, this dashboard is an invaluable asset for managing and improving agricultural exports.
Frequently Asked Questions (FAQs)
Click to buy Agricultural Exports KPI Dashboard in Google Sheets
1. How do I enter data into the Agricultural Exports KPI Dashboard?
Data is entered into the Actual Number Sheet, and target data is entered into the Target Sheet for each KPI. The dashboard will update automatically.
2. Can I customize the Agricultural Exports KPI Dashboard?
Yes, the dashboard is fully customizable. You can adjust KPIs, add new ones, or modify the existing layout to suit your specific needs.
3. How can the Agricultural Exports KPI Dashboard help me track export growth?
The Export Growth by Region KPI measures growth by comparing current year exports to last year’s data, helping you identify areas for expansion.
4. How does the dashboard help with budgeting?
The dashboard tracks Total Premium Collected and compares it to Claim Amount, helping you evaluate the financial performance and manage budgets.
5. Can the Agricultural Exports KPI Dashboard be used by multiple users?
Yes, the dashboard is built in Google Sheets, making it easy for multiple users to access, update, and collaborate in real time.
Visit our YouTube channel to learn step-by-step video tutorials
Youtube.com/@NeotechNavigators
Watch the step-by-step video Demo:
Click to buy Agricultural Exports KPI Dashboard in Google Sheets