Tracking employee and KPI performance over an entire year becomes challenging when data sits in multiple files or static reports. Managers often struggle to identify high performers, weak areas, and improvement opportunities. As a result, performance reviews become subjective and time-consuming.Annual Performance Summary Dashboard in Google Sheets
That is exactly why an Annual Performance Summary Dashboard in Google Sheets becomes an essential performance management tool.Annual Performance Summary Dashboard in Google Sheets
This ready-to-use dashboard helps HR teams, managers, and leadership summarize annual KPI performance using clear ratings, department-wise insights, designation analysis, and monthly trends—all in one interactive Google Sheets dashboard.
In this article, we explain how the dashboard works, its structure, charts, benefits, and best practices.Annual Performance Summary Dashboard in Google Sheets
What Is an Annual Performance Summary Dashboard in Google Sheets?
Click to Buy Annual Performance Summary Dashboard in Google Sheets
An Annual Performance Summary Dashboard is a centralized reporting tool that consolidates KPI ratings and performance outcomes for the entire year. Instead of reviewing individual appraisal sheets, decision-makers can instantly see performance distribution across departments, designations, managers, and months.Annual Performance Summary Dashboard in Google Sheets
Because the dashboard runs in Google Sheets, it offers:
-
Real-time updates
-
Easy collaboration
-
Automatic chart refresh
-
Cloud-based access
-
No additional BI software cost
This dashboard suits HR teams, performance managers, department heads, and leadership.
Key Features of the Annual Performance Summary Dashboard
Click to Buy Annual Performance Summary Dashboard in Google Sheets
This dashboard is ready to use and includes an Overview sheet with multiple analysis sections, supported by a Data input sheet.
Overview Sheet Tab
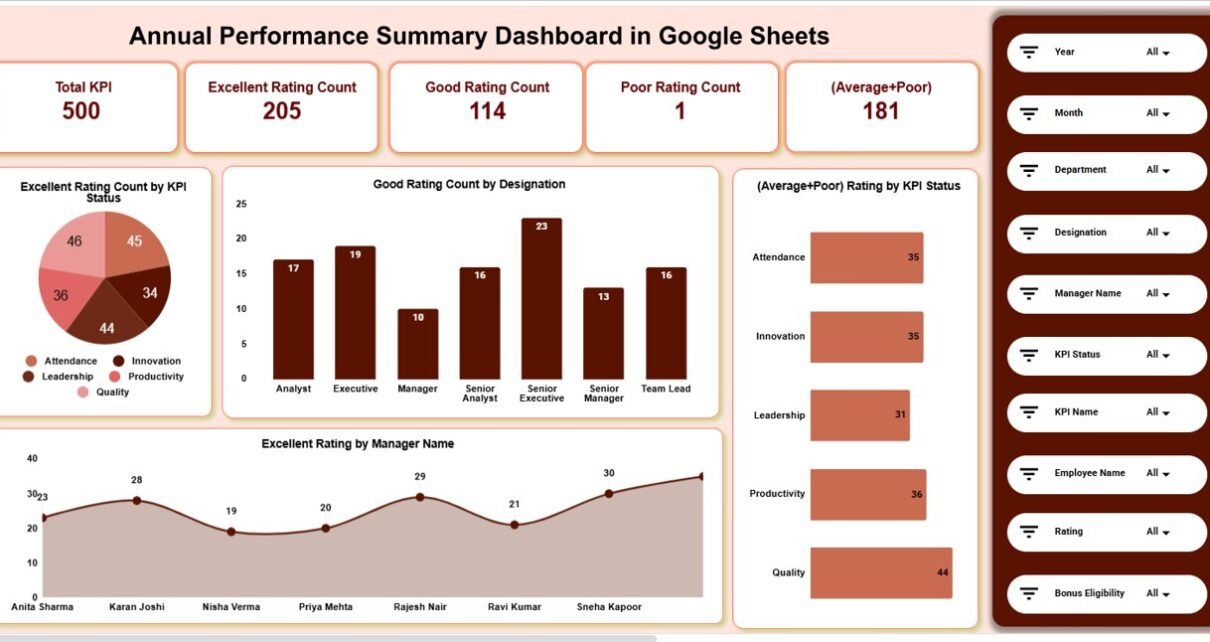
The Overview Sheet provides a high-level summary of annual performance using KPI cards and visual charts.
🔹 KPI Cards on the Dashboard
-
Total KPI – Total KPIs evaluated during the year
-
Excellent Rating Count – Number of KPIs rated Excellent
-
Good Rating Count – Number of KPIs rated Good
-
Poor Rating Count – Number of KPIs rated Poor
-
(Average + Poor) – Combined count of Average and Poor ratings
These cards help leadership quickly understand overall performance health.
Charts in the Overview Section
1️⃣ Excellent Rating Count by KPI Status
Shows how many KPIs achieved Excellent ratings across different KPI statuses.
2️⃣ Good Rating Count by Designation
Highlights which designations consistently achieve Good ratings.
3️⃣ (Average + Poor) Rating by KPI Status
Identifies underperforming KPI categories.
4️⃣ Excellent Rating by Manager Name
Helps recognize managers driving high performance.

Click to Buy Annual Performance Summary Dashboard in Google Sheets
🏢 Department Analysis
This section evaluates performance distribution across departments.
📊 Charts Included:
-
Total KPI by Department
-
Good Rating Count by Department
-
(Average + Poor) Rating by Department
-
Excellent Rating by Department
It helps HR teams identify strong and weak departments.

Click to Buy Annual Performance Summary Dashboard in Google Sheets
🧑💼 Designation Analysis
This section analyzes performance based on employee designation.
📊 Charts Included:
-
Total KPI by Designation
-
Good Rating Count by Designation
-
(Average + Poor) Rating by Designation
-
Excellent Rating by Designation
It supports role-based performance evaluation and talent planning.

📌 KPI Status Analysis
This section focuses on performance by KPI status.
📊 Charts Included:
-
Total KPI by KPI Status
-
Good Rating Count by KPI Status
-
(Average + Poor) Rating by KPI Status
-
Excellent Rating by KPI Status
It helps identify which KPIs consistently perform well or poorly.

Click to Buy Annual Performance Summary Dashboard in Google Sheets
📅 Monthly Trends Analysis
This section shows how performance evolved throughout the year.
📊 Charts Included:
-
Total KPI by Month
-
Good Rating Count by Month
-
(Average + Poor) Rating by Month
-
Excellent Rating by Month
It helps organizations detect seasonal performance patterns.

Annual Performance Summary Dashboard in Google Sheets
📄 Data Input Sheet Tab
The Data Sheet serves as the backbone of the dashboard.
Typical columns include:
-
KPI Name
-
KPI Status
-
Department
-
Designation
-
Manager Name
-
Rating
-
Month
Once data is entered or updated, all dashboard charts refresh automatically.
Why Organizations Need an Annual Performance Summary Dashboard
Click to Buy Annual Performance Summary Dashboard in Google Sheets
Without a centralized dashboard, annual reviews become fragmented and biased. This dashboard helps organizations:
-
Standardize performance evaluation
-
Identify top and low performers
-
Support promotion and reward decisions
-
Improve workforce planning
-
Strengthen performance transparency
A single dashboard creates clarity and consistency.
Advantages of the Annual Performance Summary Dashboard
Click to Buy Annual Performance Summary Dashboard in Google Sheets
-
Centralized annual performance tracking
-
Clear rating distribution visibility
-
Department-wise and role-wise insights
-
Better manager accountability
-
Faster appraisal and review cycles
-
Cost-effective Google Sheets solution
Opportunities for Improvement
You can enhance this dashboard further by adding:
-
Individual employee scorecards
-
KPI weightage calculation
-
Performance improvement plan tracking
-
Year-over-year comparison
-
Automated appraisal data import
These enhancements deepen performance analytics.
Best Practices for Using the Dashboard
Click to Buy Annual Performance Summary Dashboard in Google Sheets
-
Standardize KPI rating definitions
-
Update data regularly
-
Review department performance quarterly
-
Share insights with leadership
-
Use trends for training and development planning
-
Protect sensitive data with access controls
Conclusion
An Annual Performance Summary Dashboard in Google Sheets provides a structured, visual, and actionable way to evaluate performance across an entire organization. It replaces scattered appraisal files with a single source of truth, enabling data-driven reviews and fair decision-making. Because it is ready to use and cloud-based, teams can start tracking performance immediately.Annual Performance Summary Dashboard in Google Sheets
For organizations focused on transparency and continuous improvement, this dashboard becomes an essential HR analytics tool.
Frequently Asked Questions (FAQs)
Click to Buy Annual Performance Summary Dashboard in Google Sheets
1. Who should use this dashboard?
HR teams, managers, and leadership.
2. Can it handle large datasets?
Yes, Google Sheets supports large volumes of data.
3. Is the dashboard customizable?
Yes, all charts and fields can be modified.
4. Can it support appraisal decisions?
Yes, it provides structured performance insights.
5. Is Google Sheets secure for HR data?
Yes, with proper access permissions.
6. Does it require technical skills?
No, basic Google Sheets knowledge is enough.
Visit our YouTube channel to learn step-by-step video tutorials
Youtube.com/@NeotechNavigators
Watch the step-by-step video tutorial:
Click to Buy Annual Performance Summary Dashboard in Google Sheets