Managing an art gallery involves balancing multiple aspects – from monitoring exhibitions and artists to tracking sales and visitor engagement. Without proper oversight, it’s easy to miss trends, underperforming areas, or revenue opportunities. A well-designed Art Gallery KPI Dashboard in Google Sheets can help streamline these insights, enabling managers to make informed decisions quickly and efficiently.
In this article, we will explain everything you need to know about creating and using an Art Gallery KPI Dashboard, including key features, setup, advantages, best practices, and examples of KPIs you can track.
What Is an Art Gallery KPI Dashboard?
An Art Gallery KPI Dashboard is a digital tool, built in Google Sheets, that consolidates key performance indicators (KPIs) in one place. This dashboard provides a clear, visual overview of art gallery operations, including sales, exhibition performance, visitor metrics, and financial indicators.
Unlike scattered spreadsheets or manual reporting, this dashboard allows managers to:
-
Compare performance month-to-date (MTD) and year-to-date (YTD)
-
Track targets versus actuals
-
Analyze trends using charts and conditional formatting
-
Make data-driven decisions quickly
Why Use a KPI Dashboard for Your Art Gallery?
Click to Buy Art Gallery KPI Dashboard in Google Sheets
Art galleries often juggle multiple responsibilities simultaneously, such as:
-
Monitoring visitor attendance and engagement
-
Tracking artwork sales and revenue
-
Evaluating artist performance
-
Managing budgets and expenses
A KPI Dashboard centralizes this information, ensuring that you never overlook critical metrics. It saves time, reduces errors, and provides a single source of truth for your gallery’s performance.
Key Features of the Art Gallery KPI Dashboard in Google Sheets
Our ready-to-use Art Gallery KPI Dashboard is designed with usability in mind. It includes 6 essential worksheets:
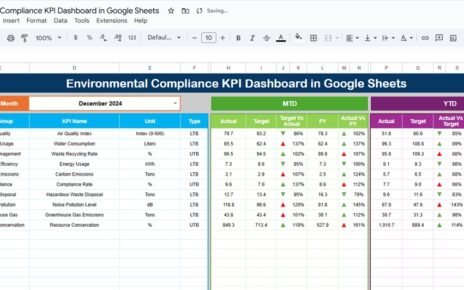
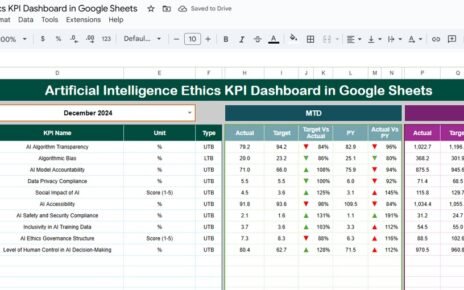
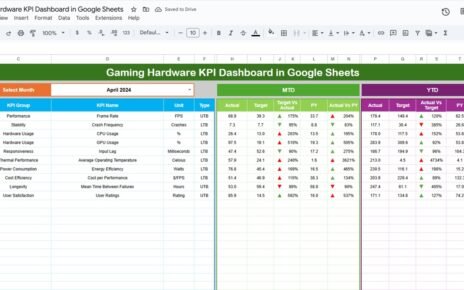
1. Dashboard Sheet Tab
The main sheet provides a snapshot of all KPIs. Features include:
-
MTD & YTD Metrics: Actual, target, and previous year values
-
Conditional Formatting: Up and down arrows to indicate performance vs. targets
-
Interactive Drop-down: Select a month to dynamically update all data

Click to Buy Art Gallery KPI Dashboard in Google Sheets
2. KPI Trend Sheet Tab
This sheet helps track the trends of each KPI over time. Key features:
-
Dropdown to select the KPI for analysis
-
KPI group, unit, type (Upper the better / Lower the better)
-
KPI formula and definition displayed for clarity

3. Actual Numbers Sheet Tab
Input your monthly actuals here:
-
MTD and YTD data entry for each KPI
-
Easy to update for new months using a simple drop-down

Click to Buy Art Gallery KPI Dashboard in Google Sheets
4. Target Sheet Tab
Set monthly and yearly targets for your KPIs:
-
Track planned vs. actual performance
-
Helps identify gaps early

5. Previous Year Numbers Sheet Tab
Capture last year’s performance for trend comparison:
-
Enables year-over-year analysis
-
Provides historical context for decision-making

Click to Buy Art Gallery KPI Dashboard in Google Sheets
6. KPI Definition Sheet Tab
Document every KPI for clarity:
-
KPI name, group, unit, formula, and definition
-
Indicates whether lower or higher values are better

Examples of KPIs to Track in Your Art Gallery Dashboard
Some essential KPIs for art galleries include:
-
Artwork Sales ($): Total revenue generated from sales
-
Visitor Count: Number of visitors per month
-
Exhibition Attendance Rate (%): Visitors vs. exhibition capacity
-
Average Sale per Visitor ($): Revenue per visitor
-
Artist Performance Score: Based on sales, engagement, and feedback
-
Budget Utilization (%): Actual expenditure vs. planned budget
Each KPI should include:
-
Unit of Measure (e.g., $, %, count)
-
Formula (e.g., Total Sales ÷ Number of Visitors)
-
Performance Type (Upper the better / Lower the better)
Advantages of Using the Art Gallery KPI Dashboard
Click to Buy Art Gallery KPI Dashboard in Google Sheets
-
Real-Time Insights: Monitor performance instantly with dynamic charts
-
Time-Saving: Consolidates all data in one sheet
-
Trend Analysis: Compare MTD, YTD, and previous year data
-
Target Tracking: Quickly identify gaps between actuals and goals
-
Data Accuracy: Reduces errors compared to manual reporting
Best Practices for Using Your Art Gallery KPI Dashboard
-
Update actual numbers monthly to maintain accuracy
-
Define clear targets and track progress against them
-
Use conditional formatting to highlight performance issues
-
Customize KPIs based on gallery-specific goals
-
Review trends and take action to improve underperforming areas
How to Implement Your Dashboard in Google Sheets
Click to Buy Art Gallery KPI Dashboard in Google Sheets
-
Input your data in the Actual Numbers sheet for MTD and YTD
-
Set targets in the Target sheet
-
Enter previous year data in the Previous Year Numbers sheet
-
Define your KPIs in the KPI Definition sheet
-
Use the Dashboard sheet to visualize all KPIs and track progress
-
Use the KPI Trend sheet for in-depth analysis and decision-making
Frequently Asked Questions (FAQs)
Click to Buy Art Gallery KPI Dashboard in Google Sheets
Q1: Can I customize the KPIs in the dashboard?
Yes, you can add or remove KPIs depending on your gallery’s focus areas.
Q2: Is the dashboard suitable for multiple galleries?
Absolutely. You can duplicate sheets or use separate tabs for each gallery.
Q3: How do I track MTD and YTD metrics?
Simply update the Actual Numbers sheet each month; the dashboard will calculate MTD and YTD automatically.
Q4: Can I visualize trends over multiple years?
Yes, by using the Previous Year Numbers sheet alongside the KPI Trend sheet.
Q5: Do I need any advanced tools to use this dashboard?
No, it’s fully functional in Google Sheets without any additional software.
Visit our YouTube channel to learn step-by-step video tutorials
Youtube.com/@NeotechNavigators
Watch the step-by-step video Demo: