Efficient asset management requires complete visibility into asset usage, depreciation, condition, and value. The Asset Utilization & Status Dashboard in Google Sheets offers a ready-to-use, cloud-based solution to track all assets in one place.
Asset Utilization & Status Dashboard in Google Sheets
This easy-to-manage dashboard helps businesses monitor active assets, vendor performance, department-level usage, and monthly value trends using automated charts and key metrics.
What Is an Asset Utilization & Status Dashboard in Google Sheets?
Click to Buy Asset Utilization & Status Dashboard in Google Sheets
The Asset Utilization & Status Dashboard is a centralized monitoring tool used to track asset performance, financial value, and operational readiness.
Asset Utilization & Status Dashboard in Google Sheets
It visualizes all asset-related KPIs — including total assets, depreciation, warranty status, and utilization — helping teams make faster decisions, reduce costs, and improve asset lifecycle planning.
You can instantly check the number of active assets, total cost, book value, vendor performance, and department-level usage.
Dashboard Structure
This dashboard is divided into multiple sections, each offering a detailed view of asset usage, condition, and financial metrics.
Overview Sheet Tab
This is the main page that shows complete asset status at a glance.
Asset Utilization & Status Dashboard in Google Sheets
Card:
-
Total Assets
-
Active Count
-
Total Cost (USD)
-
Depreciation (USD)
-
Net Book Value (USD)
Chart:
-
Active Assets by Asset Type
-
Total Assets by Location
-
Net Book Value (USD) by Location
-
Total Assets by Asset Condition
These visuals help identify where assets are located, which types are most used, and the current book value across locations.

Click to Buy Asset Utilization & Status Dashboard in Google Sheets
Vendor Analysis
This section displays vendor-level insights to understand asset quality, warranty status, and vendor contribution.
Vendor Analysis
Chart:
-
Under Warranty Assets by Vendor
-
Net Book Value (USD) by Vendor
-
Depreciation (USD) by Vendor
-
Inactive Count by Vendor
This view helps you compare vendor performance and identify which suppliers provide reliable assets.

Click to Buy Asset Utilization & Status Dashboard in Google Sheets
Department Analysis
This tab helps track asset distribution and usage across departments.
Department Analysis
Chart:
-
Under Warranty Assets by Department
-
Net Book Value (USD) by Department
-
Depreciation (USD) by Department
-
Inactive Count by Department
Managers can easily identify departments with higher asset consumption or outdated assets requiring replacement.

Asset Type Analysis
This sheet evaluates how different categories of assets perform and depreciate.
Asset Type Analysis
Chart:
-
Under Warranty Assets by Asset Type
-
Net Book Value (USD) by Asset Type
-
Depreciation (USD) by Asset Type
-
Inactive Count by Asset Type
This helps highlight which asset types hold the highest value and which categories need maintenance or disposal.

Click to Buy Asset Utilization & Status Dashboard in Google Sheets
Monthly Trends
This section shows how asset value and activity change every month.
Monthly Trends
Chart:
-
Net Book Value (USD) by Month
-
Depreciation (USD) by Month
-
Inactive Count by Month
Trend analysis helps understand seasonal fluctuations, maintenance cycles, and long-term financial trends.

Click to Buy Asset Utilization & Status Dashboard in Google Sheets
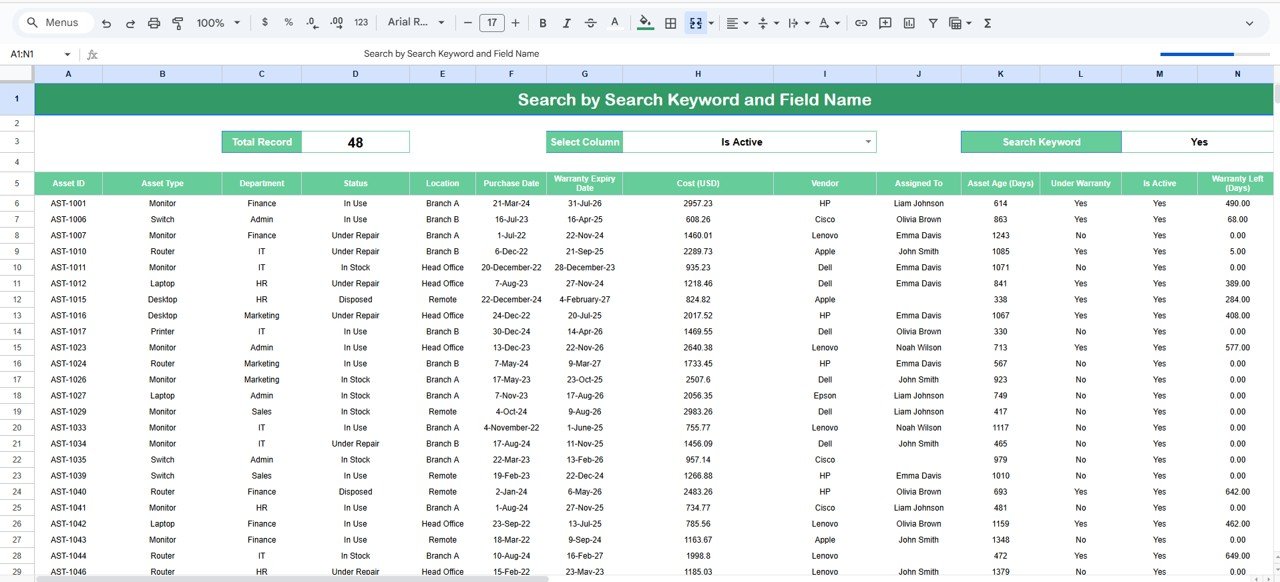
Search Sheet Tab
The Search Tab allows users to quickly locate any asset using keywords and specific fields.
Search Sheet Tab
Search Features:
-
Search by Keyword
-
Search by Field Name (Asset ID, Department, Vendor, Location, Condition, etc.)
This feature makes it easy to find asset information without manually scrolling through large datasets.
Data Sheet Tab
The Data Sheet contains the complete asset database, including fields such as:
-
Asset ID
-
Asset Type
-
Vendor
-
Department
-
Location
-
Purchase Date
-
Cost
-
Depreciation
-
Warranty Expiry
-
Condition
-
Status
-
Net Book Value
All dashboard charts and KPIs are generated automatically from this sheet.

Click to Buy Asset Utilization & Status Dashboard in Google Sheets
Advantages
📊 Complete Asset Visibility: Track asset usage, condition, and financial value in one dashboard.
💰 Accurate Financial Insights: View total cost, depreciation, and real-time net book value.
🧠 Better Decision-Making: Identify underperforming assets, inactive items, and replacement needs.
🤝 Vendor Comparison: Evaluate vendors based on warranty, depreciation, and inactive counts.
☁️ Cloud-Based & Collaborative: Google Sheets makes data sharing and updates simple.
Opportunities for Improvement
-
Add automated alerts for upcoming warranty expiries
-
Use Google Forms for recording new asset entries
-
Incorporate QR codes for quick scanning and tracking
-
Add lifecycle stages such as procurement, repair, and disposal
-
Include a KPI comparison section for monthly or yearly results
Best Practices
Click to Buy Asset Utilization & Status Dashboard in Google Sheets
-
Update the data sheet regularly to maintain accuracy
-
Review depreciation values quarterly for financial planning
-
Track inactive assets monthly to prevent unnecessary purchases
-
Use filters while analyzing vendor, department, or asset type
-
Maintain clear and consistent naming conventions in the data sheet
Conclusion
The Asset Utilization & Status Dashboard in Google Sheets provides a powerful and easy-to-use platform for monitoring asset health, status, and value. With automated charts, department-wise analysis, vendor performance insights, and monthly trends, this dashboard helps businesses manage assets efficiently and make data-driven decisions.
Watch the step-by-step video Demo:
Visit our YouTube channel to learn step-by-step video tutorials
Youtube.com/@NeotechNavigators
Click to Buy Asset Utilization & Status Dashboard in Google Sheets