As the automotive industry moves toward automation and smart mobility, monitoring performance and safety metrics becomes crucial. The Autonomous Vehicle KPI Dashboard in Google Sheets is a ready-to-use analytics solution designed to help engineering, R&D, and fleet management teams track performance, reliability, and safety KPIs in one centralized dashboard.Autonomous Vehicle KPI Dashboard in Google Sheets
In this article, you’ll learn about its structure, KPI definitions, formulas, and practical uses for data-driven decision-making.Autonomous Vehicle KPI Dashboard in Google Sheets
What Is an Autonomous Vehicle KPI Dashboard?
An Autonomous Vehicle KPI Dashboard is a data-driven reporting tool built in Google Sheets to track real-time performance metrics for self-driving vehicles. It consolidates data from test runs, software updates, and fleet analytics into visual, easy-to-understand dashboards.
The dashboard supports Month-to-Date (MTD) and Year-to-Date (YTD) comparisons, includes target vs. actual visual indicators, and automatically highlights performance changes with conditional formatting and trend arrows.
Structure of the Dashboard
Click to Buy Autonomous Vehicle KPI Dashboard in Google Sheets
The Autonomous Vehicle KPI Dashboard in Google Sheets includes six major worksheets:
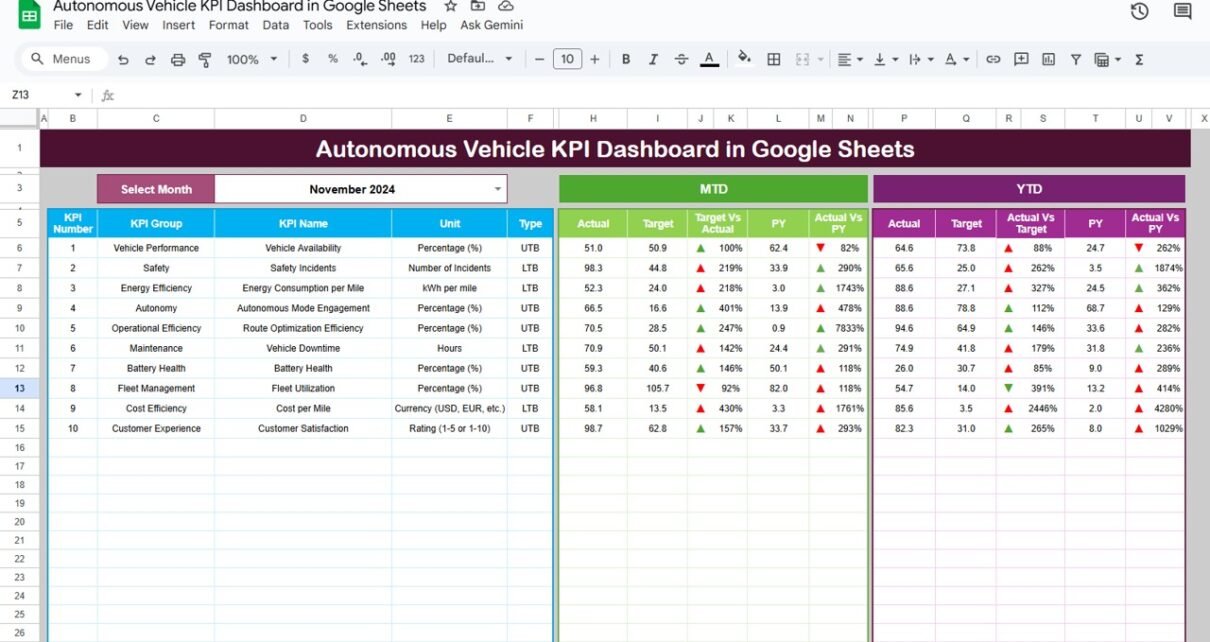
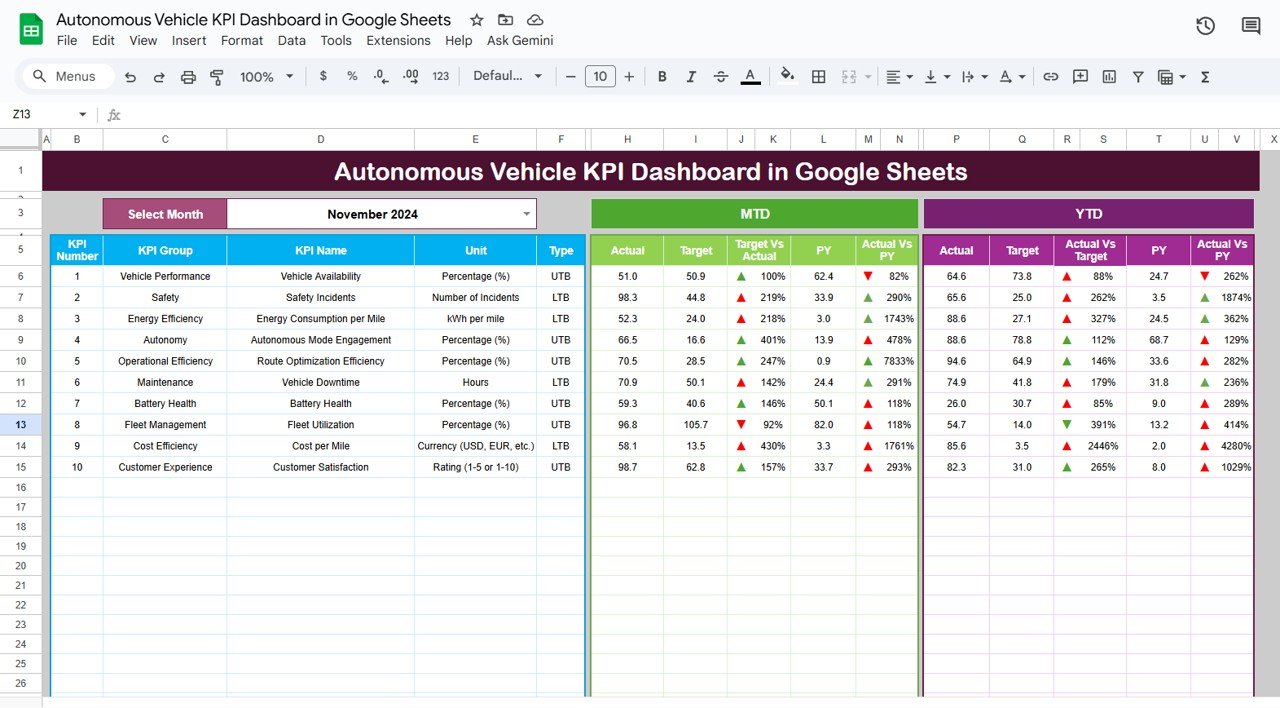
Dashboard Sheet Tab
This is the main visualization hub of the dashboard. It shows all key KPIs, with dynamic month selection via a dropdown in cell D3.
Features:
-
MTD and YTD views for Actual, Target, and Previous Year.
-
Conditional formatting with up/down arrows to show improvement or decline.
-
Automatic recalculation based on month selection.
Metrics covered include:
-
Vehicle safety and reliability
-
Operational efficiency
-
AI decision-making accuracy
-
Ride comfort and fuel performance
Click to Buy Autonomous Vehicle KPI Dashboard in Google Sheets
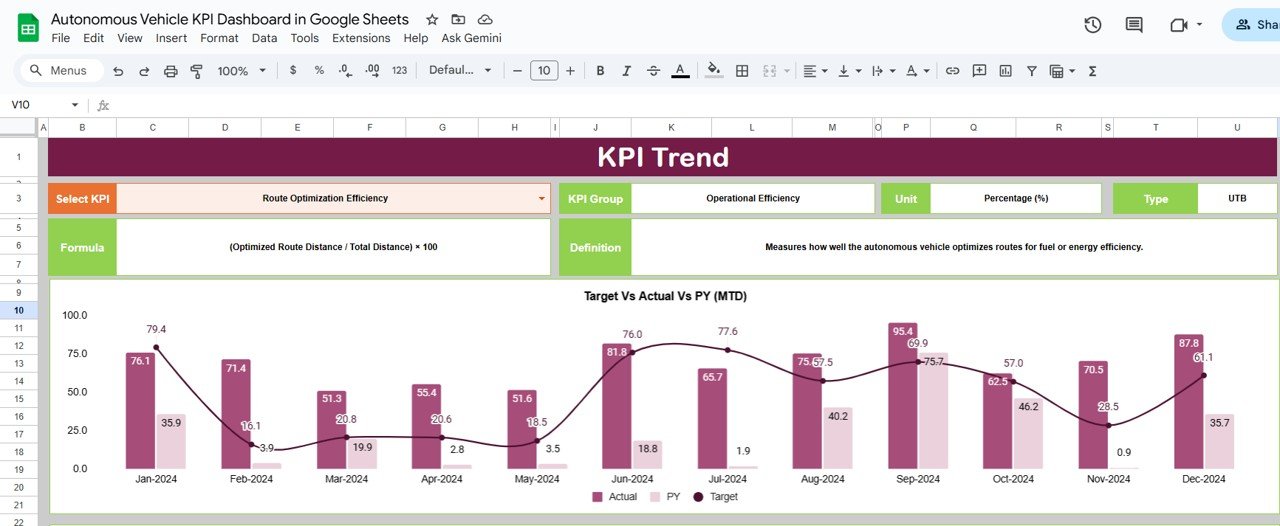
KPI Trend Sheet Tab
This sheet provides individual KPI insights over time.
Select a KPI name from the dropdown (cell C3) to view its performance trend, including MTD, YTD, and comparative analysis.
Displayed details include:
-
KPI Group
-
Unit
-
Type (Upper the Better or Lower the Better)
-
Formula
-
Definition
Click to Buy Autonomous Vehicle KPI Dashboard in Google Sheets
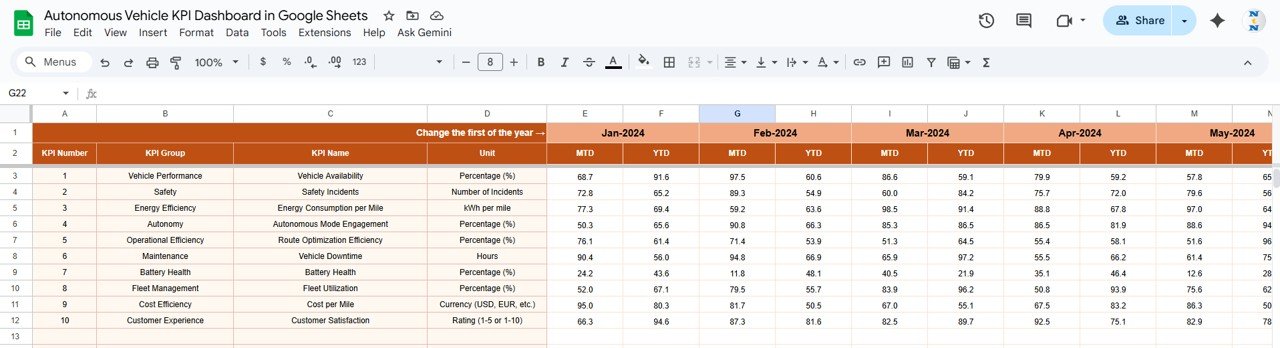
Actual Number Sheet Tab
Here you input actual results for each KPI for each month.
You can set the first month of the fiscal year in cell E1, which will adjust calculations automatically.
Columns include:
-
Month
-
Year
-
KPI Name
-
MTD Actual
-
YTD Actual
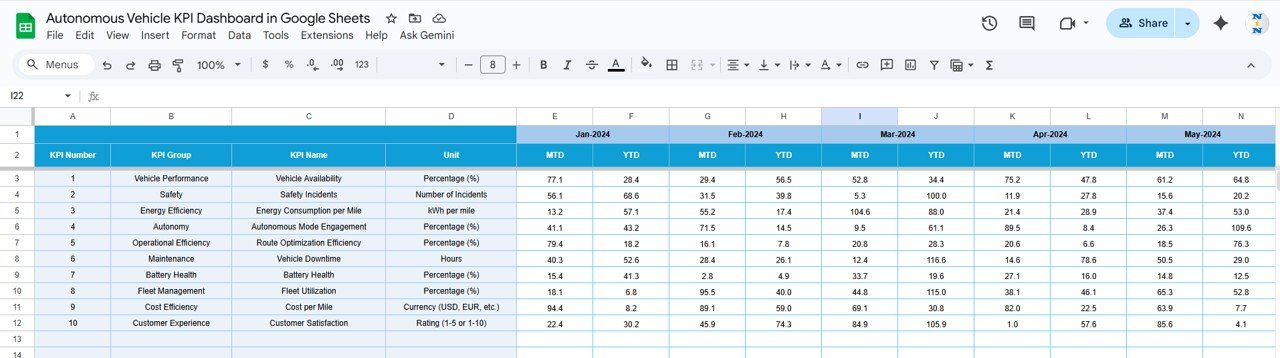
Target Sheet Tab
Record your target values for each KPI here, both MTD and YTD.
These targets are compared against actual results in the dashboard view.
Click to Buy Autonomous Vehicle KPI Dashboard in Google Sheets
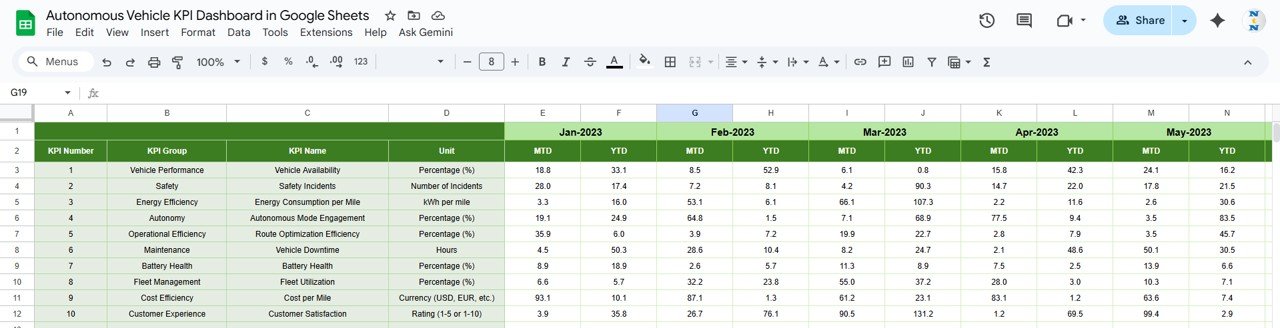
Previous Year Number Sheet Tab
Enter last year’s KPI data for benchmarking purposes.
This allows year-over-year comparison through PY vs Actual trend charts.
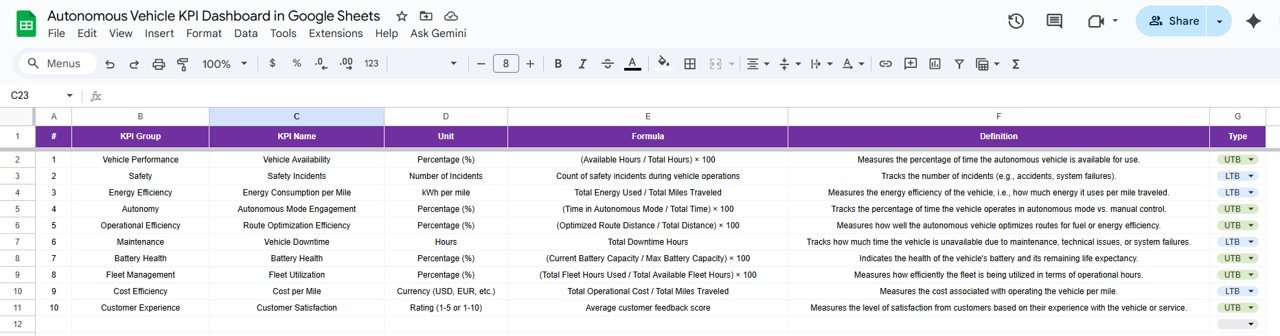
KPI Definition Sheet Tab
This sheet defines each KPI — including group, unit, formula, definition, and performance type (UTB or LTB).
Click to Buy Autonomous Vehicle KPI Dashboard in Google Sheets
Advantages of the Dashboard
-
Real-Time Visibility: Monitor critical performance metrics of autonomous vehicles instantly.
-
Comparative Insights: Analyze MTD, YTD, Target, and PY data side by side.
-
Automation Ready: Fully compatible with Google Sheets formulas and data imports.
-
Team Collaboration: Accessible to multiple engineers, analysts, and managers simultaneously.
-
Data Accuracy: Eliminates manual report errors with formula-based aggregation.
Opportunities for Enhancement
Click to Buy Autonomous Vehicle KPI Dashboard in Google Sheets
-
Google Data Studio Integration: Extend visuals for management reports.
-
Automated Data Imports: Use Google Apps Script to fetch telemetry or sensor data.
-
Alert Mechanisms: Set email triggers for low AI accuracy or high downtime.
-
Predictive Maintenance Models: Incorporate AI predictions for component failures.
Best Practices
-
Input data consistently for each month.
-
Use standard KPI naming conventions across sheets.
-
Protect dashboard formulas from editing.
-
Review “Lower the Better” KPIs weekly for operational improvement.
-
Use the KPI Trend tab to identify seasonal or recurring issues.
Conclusion
Click to Buy Autonomous Vehicle KPI Dashboard in Google Sheets
The Autonomous Vehicle KPI Dashboard in Google Sheets is a vital tool for automotive engineers, R&D teams, and data analysts. It centralizes safety, performance, and efficiency metrics in one intuitive, automated dashboard.
With interactive visuals, KPI trends, and month-to-month compa
Visit our YouTube channel to learn step-by-step video tutorials
Youtube.com/@NeotechNavigators
Watch the step-by-step video Demo:
Click to Buy Autonomous Vehicle KPI Dashboard in Google Sheets