In today’s competitive financial industry, banks must continuously monitor performance, manage risks, improve customer satisfaction, and achieve regulatory compliance. However, many banking institutions still rely on manual reporting and disconnected spreadsheets, which makes performance tracking slow and inefficient. Therefore, financial organizations increasingly adopt structured KPI scorecards to monitor key metrics in real time.
The Banking KPI Scorecard in Google Sheets provides a smart, simple, and ready-to-use solution that helps banks track operational and financial performance using measurable Key Performance Indicators (KPIs). With automated calculations, visual indicators, and monthly performance tracking, this scorecard transforms complex banking data into clear and actionable insights.
In this comprehensive article, you will learn everything about the Banking KPI Scorecard in Google Sheets, including features, structure, benefits, implementation steps, best practices, and frequently asked questions.
What Is a Banking KPI Scorecard in Google Sheets?
A Banking KPI Scorecard in Google Sheets is an interactive performance monitoring tool designed to evaluate banking operations using predefined KPIs. Instead of analyzing lengthy financial reports, users can quickly review performance through visual indicators such as traffic lights, arrows, and comparison metrics.
Because the scorecard automatically updates based on selected months, managers gain instant insights into both monthly and yearly performance trends.
Why Do Banks Need a KPI Scorecard?
Banks operate in a highly regulated and performance-driven environment. Therefore, they must track multiple performance indicators simultaneously.
A KPI scorecard helps banks:
- Monitor financial performance regularly
- Track operational efficiency
- Measure customer service quality
- Compare targets with actual performance
- Identify performance gaps early
- Improve strategic planning
Consequently, decision-makers respond faster to operational challenges.
Key Features of the Banking KPI Scorecard in Google Sheets
This ready-to-use template includes structured worksheets designed for easy analysis and reporting.
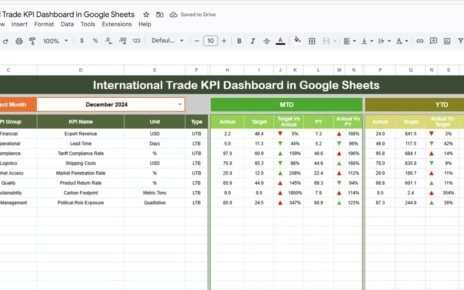
Scorecard Dashboard – The Main Performance View
The Scorecard Dashboard acts as the primary analysis page.
Main Functionalities
- Month dropdown at the top for selecting reporting period
- Automatic update of all KPI numbers
- Dynamic performance comparison
- Visual indicators using traffic lights and arrows
Performance Views Available
- MTD (Month-To-Date) performance view
- YTD (Year-To-Date) performance view
Users can switch between monthly and yearly analysis easily. As a result, managers understand both short-term and long-term performance instantly.

KPI Trend Sheet Tab – How Can You Analyze KPI Trends?
The Trend Sheet provides deeper KPI-level insights.
Features
-
KPI selection dropdown available in cell C3
-
Automatic display of KPI information
-
Trend-based performance monitoring
Information Displayed
- KPI Group
- KPI Unit
- KPI Type (Lower the Better / Upper the Better)
- KPI Formula
- KPI Definition
Therefore, users understand not only KPI performance but also KPI logic and purpose.

KPI Definition Sheet – Standardizing Performance Metrics
The KPI Definition Sheet serves as the foundation of the scorecard.
Columns Included
- KPI Name
- KPI Group
- Unit
- Formula
- KPI Definition
This structure ensures that all stakeholders interpret KPIs consistently.

Data Input Sheet – Where Performance Data Is Entered
The Data Input Sheet allows users to enter actual performance numbers.
Users simply input:
- Monthly KPI values
- Operational performance data
- Financial results
Once data is entered, the dashboard updates automatically. Consequently, reporting becomes faster and error-free.

Colour Settings Sheet – Visual Performance Indicators
The Colour Settings sheet controls dashboard formatting.
Purpose
- Define traffic light thresholds
- Set performance color rules
- Control KPI status indicators
Because visual signals highlight performance instantly, decision-makers identify issues quickly.

Advantages of Banking KPI Scorecard in Google Sheets
Centralized Performance Monitoring
All banking KPIs remain available in one place.
Automated Monthly Reporting
Users avoid manual report preparation.
Easy Performance Comparison
Actual vs Target comparisons appear instantly.
Visual Decision Support
Traffic lights and arrows simplify interpretation.
Cloud-Based Collaboration
Teams access reports from anywhere.
Cost-Effective Analytics Tool
No expensive software investment required.
How Does the Scorecard Improve Banking Operations?
Banks manage complex operations daily. However, structured KPI tracking improves efficiency.
The scorecard helps banks:
- Detect performance decline early
- Improve lending performance
- Monitor operational costs
- Enhance customer service quality
- Support regulatory reporting
- Improve profitability tracking
Therefore, management makes faster and smarter decisions.
Best Practices for the Banking KPI Scorecard in Google Sheets
Keep KPI Definitions Clear
Ensure everyone understands KPI meaning.
Update Data Regularly
Monthly updates maintain dashboard accuracy.
Focus on Strategic KPIs
Avoid tracking unnecessary metrics.
Monitor Risk KPIs Closely
Track NPL ratio and operational risks.
Protect Formula Cells
Prevent accidental changes.
Review Trends Consistently
Monthly reviews improve forecasting accuracy.
Why Use Google Sheets for Banking KPI Tracking?
Organizations choose Google Sheets because:
- Cloud-based accessibility
- Easy sharing and collaboration
- Simple customization
- Automatic calculations
- Low learning curve
- Integration with exported banking data
Therefore, banks implement analytics quickly without IT complexity.
Conclusion
The Banking KPI Scorecard in Google Sheets simplifies performance monitoring by converting complex banking data into clear visual insights. Instead of relying on manual reports, banks gain structured analysis, automated comparisons, and actionable intelligence.
Because the scorecard combines flexibility, automation, and visualization, banking teams improve operational efficiency, strengthen decision-making, and enhance financial performance.
Ultimately, organizations that adopt KPI scorecards build stronger, data-driven banking operations.
Frequently Asked Questions (FAQs)
What is a Banking KPI Scorecard?
It is a dashboard that tracks banking performance using measurable KPIs.
Can beginners use this template?
Yes, basic Google Sheets knowledge is sufficient.
Does the scorecard update automatically?
Yes, once data is entered, all visuals update automatically.
Can KPIs be customized?
Yes, users can modify KPIs anytime.
Is it suitable for small banks?
Yes, it works for banks of all sizes.
How often should data be updated?
Monthly updates are recommended.
Does it support yearly analysis?
Yes, users can switch between MTD and YTD views.
Can teams collaborate on it?
Yes, Google Sheets allows real-time collaboration.
Watch the step-by-step video tutorial:
Visit our YouTube channel to learn step-by-step video tutorials