Banking operations handle thousands of transactions, service requests, compliance checks, and customer interactions every single day. Because of this scale and complexity, banks must track operational performance carefully. Without a structured monitoring system, teams struggle with delays, errors, rising costs, and declining service quality.Banking Operations KPI Dashboard in Google Sheets
A Banking Operations KPI Dashboard in Google Sheets solves these challenges by providing a centralized, real-time view of all key operational metrics. This ready-to-use dashboard converts raw banking data into meaningful insights using KPIs, trend analysis, and target comparisons.Banking Operations KPI Dashboard in Google Sheets
What Is a Banking Operations KPI Dashboard in Google Sheets?
A Banking Operations KPI Dashboard is a performance monitoring tool designed to track daily, monthly, and yearly banking operations. It measures transaction efficiency, service quality, compliance performance, risk handling, and cost control.
Because this dashboard is built in Google Sheets, it offers several advantages:
-
Cloud-based access from anywhere
-
Real-time updates
-
Easy collaboration across teams
-
No expensive BI software
-
Simple customization
The dashboard becomes a single source of truth for operations managers, branch managers, compliance teams, and senior leadership.
Key Features of the Banking Operations KPI Dashboard
Click to Buy Banking Operations KPI Dashboard in Google Sheets
This dashboard is ready to use and structured for both operational review and strategic analysis. Key features include:
- Month selector for dynamic reporting
- MTD and YTD performance tracking
- Target vs Actual comparison
- Previous Year comparison
- Conditional formatting with up/down arrows
- KPI-wise trend analysis
- Clear KPI definitions and formulas
Each feature supports faster decision-making and improved accountability.
Dashboard Worksheet Structure (6 Sheets Explained)
The Banking Operations KPI Dashboard includes 6 well-structured worksheet tabs, each with a specific purpose.
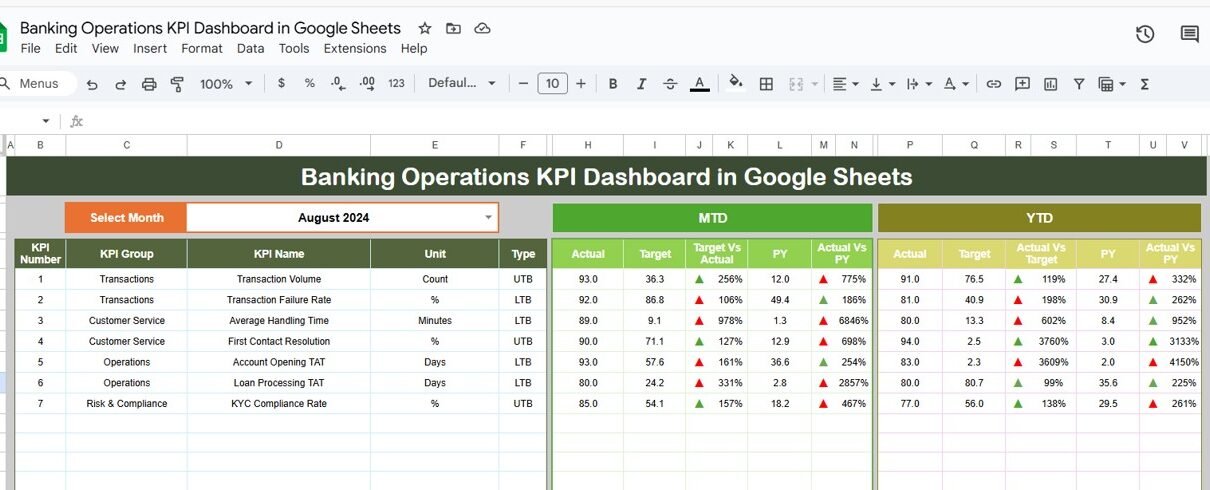
1. Dashboard Sheet Tab (Main Dashboard)
This is the primary view of the entire dashboard.
-
In cell D3, you select the month from a dropdown.
-
Once the month changes, the entire dashboard updates automatically.
The dashboard displays:
MTD (Month-to-Date)
-
MTD Actual
-
MTD Target
-
MTD Previous Year
-
Target vs Actual
-
Previous Year vs Actual
YTD (Year-to-Date)
-
YTD Actual
-
YTD Target
-
YTD Previous Year
-
Target vs Actual
-
Previous Year vs Actual
Conditional formatting arrows make performance interpretation instant:
-
▲ Green = Improvement
-
▼ Red = Decline
This sheet is ideal for leadership reviews and monthly performance meetings.

Click to Buy Banking Operations KPI Dashboard in Google Sheets
2. KPI Trend Sheet Tab
This sheet allows deep KPI analysis.
-
Select any KPI from the dropdown in cell C3.
The sheet displays:
- KPI Group
- Unit
- KPI Type (LTB / UTB)
- Formula
- Definition
You also see month-wise trends, which help identify:
-
Process bottlenecks
-
Seasonal patterns
-
Performance improvements
-
Operational risks

Click to Buy Banking Operations KPI Dashboard in Google Sheets
3. Actual Number Sheet Tab
This sheet captures actual performance data.
-
Enter MTD and YTD actual values for each KPI.
-
Select the first month of the year in cell E1.
-
The structure adjusts automatically for all months.
This sheet acts as the operational data input layer.

Click to Buy Banking Operations KPI Dashboard in Google Sheets
4. Target Sheet Tab
This sheet stores planned targets for each KPI.
-
Enter monthly targets (MTD).
-
Enter cumulative targets (YTD).
Targets allow teams to:
-
Track goal achievement
-
Control operational drift
-
Maintain service standards

Click to Buy Banking Operations KPI Dashboard in Google Sheets
5. Previous Year Number Sheet Tab
This sheet holds last year’s data.
It enables:
-
Year-over-year comparison
-
Long-term trend analysis
-
Process maturity assessment

6. KPI Definition Sheet Tab
This is the reference backbone of the dashboard.
It includes:
-
KPI Name
-
KPI Group
-
Unit
-
Formula
-
Definition
-
KPI Type (Lower/Upper the Better)
This sheet ensures KPI clarity and consistency across the organization.

Click to Buy Banking Operations KPI Dashboard in Google Sheets
Why Banking Teams Need This Dashboard
Banks operate under strict regulatory pressure and customer expectations. This dashboard helps teams:
-
Monitor efficiency daily
-
Control operational risk
-
Improve compliance
-
Reduce processing delays
-
Enhance customer experience
-
Optimize staffing and costs
Advantages of Banking Operations KPI Dashboard
-
Centralized operational visibility
-
Faster decision-making
-
Reduced manual reporting
-
Improved compliance monitoring
-
Better branch and team accountability
-
Scalable across departments and branches
Opportunities for Improvement
Click to Buy Banking Operations KPI Dashboard in Google Sheets
Banks can enhance the dashboard by adding:
-
Branch-wise drill-downs
-
Automation from core banking systems
-
SLA breach alerts
-
Risk scoring models
-
Predictive analytics
Best Practices for Using the Dashboard
-
Update actuals regularly
-
Review KPIs monthly
-
Set realistic targets
-
Train teams on KPI definitions
-
Use trend analysis for process improvement
-
Protect data with access controls
Conclusion
Click to Buy Banking Operations KPI Dashboard in Google Sheets
A Banking Operations KPI Dashboard in Google Sheets provides a powerful, flexible, and cost-effective way to monitor operational performance. With structured KPIs, clear targets, and real-time visibility, banks gain better control over efficiency, risk, and service quality. This dashboard supports smarter decisions, stronger compliance, and continuous operational improvement.
Frequently Asked Questions (FAQs)
1. Who should use this dashboard?
Operations managers, branch managers, compliance teams, and leadership.
2. Can KPIs be customized?
Yes, KPIs can be added or modified easily.
3. Is Google Sheets secure for banking data?
Yes, when proper access controls are applied.
4. Can this dashboard support multiple branches?
Yes, with structured data inputs.
5. Does it support monthly and yearly tracking?
Yes, both MTD and YTD analysis are built in.
Visit our YouTube channel to learn step-by-step video tutorials
Youtube.com/@NeotechNavigators
Watch the step-by-step video tutorial:
Click to Buy Banking Operations KPI Dashboard in Google Sheets