The biotechnology industry operates in a highly data-driven environment. Organizations must track research progress, operational efficiency, regulatory compliance, and financial performance simultaneously. However, many biotech teams still manage performance tracking using disconnected spreadsheets and manual reports. As a result, they lose visibility, delay decisions, and struggle to measure real progress.
Therefore, companies now adopt structured KPI scorecards to monitor performance clearly. A Biotechnology KPI Scorecard in Google Sheets provides a practical and powerful solution to track key performance indicators using automated calculations, visual signals, and organized analytics.
In this comprehensive guide, you will learn how the Biotechnology KPI Scorecard works, its features, benefits, best practices, and how organizations can use it to improve decision-making.
What Is a Biotechnology KPI Scorecard in Google Sheets?
A Biotechnology KPI Scorecard in Google Sheets is a ready-to-use performance tracking template designed to measure biotechnology operations using Key Performance Indicators (KPIs).
Instead of reviewing long reports, users can analyze performance through a structured monthly and yearly scorecard. Because Google Sheets works in the cloud, teams can collaborate and update performance data in real time.
The scorecard tracks 10 different KPIs, allowing organizations to evaluate operational and strategic performance efficiently.
Why Do Biotechnology Organizations Need KPI Scorecards?
Biotechnology companies deal with complex processes such as research development, laboratory operations, production efficiency, and compliance tracking. Consequently, performance measurement becomes essential.
Without a KPI scorecard, organizations often face:
- Lack of performance visibility
- Delayed reporting processes
- Inconsistent KPI definitions
- Difficulty comparing monthly results
- Poor strategic decision-making
However, a KPI scorecard solves these challenges by organizing performance into measurable indicators.
Key Features of Biotechnology KPI Scorecard in Google Sheets
Click to Buy Biotechnology KPI Scorecard In Google Sheets
This ready-to-use template includes multiple worksheet tabs designed for structured KPI monitoring.
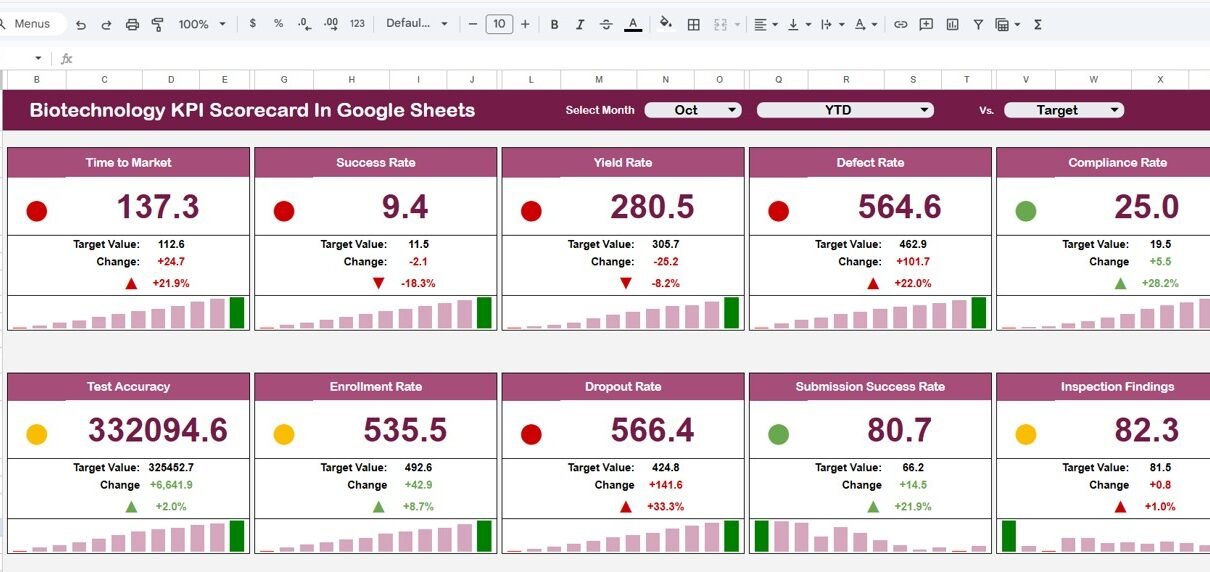
Scorecard Dashboard – Monthly and Yearly Performance Overview
The main scorecard displays overall KPI performance.
Core Functionalities
-
Month dropdown selector at the top
-
Select any month to view monthly performance
-
Dashboard automatically updates all numbers
-
Traffic light indicators change dynamically
-
Up and down arrows show percentage changes
Users can easily switch between:
-
MTD (Month-To-Date) performance
-
YTD (Year-To-Date) performance
Because the dashboard updates automatically, users instantly view performance trends.

Click to Buy Biotechnology KPI Scorecard In Google Sheets
KPI Trend Sheet Tab – Detailed KPI Analysis
The Trend Sheet helps users analyze individual KPIs in detail.
How It Works
-
Select KPI from dropdown in cell C3
-
Dashboard displays KPI information automatically
Information Available
-
KPI Group
-
KPI Unit
-
KPI Type
-
Performance Direction:
-
Lower the Better
-
Upper the Better
-
This structure ensures clear KPI understanding across teams.

Click to Buy Biotechnology KPI Scorecard In Google Sheets
KPI Definition Sheet Tab – Central KPI Documentation
The KPI Definition Sheet acts as a reference library.
Data Maintained
- KPI Name
- KPI Group
- KPI Unit
- KPI Formula
- KPI Definition
Because all definitions stay documented, organizations maintain consistency in performance measurement.
Moreover, new employees quickly understand KPI logic.

Click to Buy Biotechnology KPI Scorecard In Google Sheets
Data Input Sheet Tab – Performance Data Entry
The Data Input Sheet allows users to enter KPI values.
Data Entry Process
-
Input monthly KPI numbers
-
Update actual performance values
-
Dashboard refreshes automatically
Since the process remains simple, users minimize data entry errors.

Click to Buy Biotechnology KPI Scorecard In Google Sheets
Colour Settings – Visual Performance Indicators
Visual signals improve decision-making speed.
Included Indicators
-
Traffic light color system
-
Green → Good performance
-
Yellow → Needs attention
-
Red → Requires improvement
-
-
Up and down arrows for percentage change
These visuals help users understand KPI status instantly without complex analysis.

Click to Buy Biotechnology KPI Scorecard In Google Sheets
Advantages of Biotechnology KPI Scorecard in Google Sheets
Centralized KPI Monitoring
All performance metrics stay in one organized system.
Automated Performance Updates
Dashboard changes automatically after data entry.
Easy Collaboration
Teams access the scorecard from anywhere.
Visual Performance Indicators
Traffic lights simplify performance evaluation.
Monthly and Yearly Comparison
Users track both short-term and long-term progress.
Flexible Customization
Organizations can modify KPIs based on research goals.
Best Practices for the Biotechnology KPI Scorecard
Click to Buy Biotechnology KPI Scorecard In Google Sheets
1. Define Clear KPI Objectives
Ensure every KPI aligns with business goals.
2. Update Data Consistently
Regular updates maintain dashboard accuracy.
3. Use Standard Measurement Units
Consistency prevents reporting confusion.
4. Review KPIs Monthly
Frequent reviews support proactive decisions.
5. Train Teams on KPI Meaning
Understanding KPIs improves accountability.
6. Monitor Trends Regularly
Trend analysis highlights performance patterns.
7. Maintain Data Accuracy
Reliable data ensures meaningful insights.
Why Google Sheets Is Ideal for KPI Scorecards?
Click to Buy Biotechnology KPI Scorecard In Google Sheets
Google Sheets offers flexibility and collaboration.
Key Advantages
- Cloud-based accessibility
- Real-time collaboration
- Automatic saving
- Easy sharing with teams
- Customizable formulas
Therefore, organizations implement KPI systems without complex software.
Conclusion
The Biotechnology KPI Scorecard in Google Sheets provides a structured and efficient way to monitor performance using measurable KPIs. Instead of managing scattered reports, organizations gain centralized visibility into monthly and yearly performance.
Moreover, automated calculations, traffic light indicators, and trend analysis simplify performance evaluation. Because Google Sheets enables collaboration and flexibility, teams can implement this scorecard easily across departments.
Ultimately, organizations that measure performance consistently achieve better research outcomes, operational efficiency, and strategic growth.
Frequently Asked Questions (FAQs)
Click to Buy Biotechnology KPI Scorecard In Google Sheets
What is a Biotechnology KPI Scorecard?
It is a structured dashboard that tracks biotechnology performance using measurable KPIs.
How many KPIs can be tracked?
This template tracks 10 KPIs but allows customization.
Can beginners use this scorecard?
Yes. The template uses simple Google Sheets features.
Does the dashboard update automatically?
Yes. Once data updates, calculations and indicators refresh automatically.
Can I customize KPIs?
Yes. You can add or modify KPIs according to organizational needs.
Why use Google Sheets instead of specialized software?
Google Sheets provides flexibility, collaboration, and cost efficiency.
How often should KPI data be updated?
You should update KPI values monthly for accurate analysis.
Visit our YouTube channel to learn step-by-step video tutorials
Youtube.com/@NeotechNavigators
Watch the step-by-step video tutorial: