Blockchain and cryptocurrency have transformed the financial landscape, but to ensure success and track growth, businesses and investors need to monitor key performance indicators (KPIs). The Blockchain & Cryptocurrency KPI Dashboard in Google Sheets offers a simple yet effective way to track and manage these KPIs, helping you analyze trends, make data-driven decisions, and assess the performance of your blockchain and cryptocurrency investments. In this article, we will walk you through the key features of the Blockchain & Cryptocurrency KPI Dashboard, explain the KPIs it tracks, and show you how to make the most of this powerful tool.
What is a Blockchain & Cryptocurrency KPI Dashboard?
A Blockchain & Cryptocurrency KPI Dashboard is a tool designed to track and visualize important performance metrics related to blockchain technologies and cryptocurrency investments. By monitoring KPIs like transaction volume, coin value, market capitalization, and wallet growth, this dashboard provides users with insights that help optimize strategies, manage risks, and improve returns. The Google Sheets dashboard offers an accessible, customizable platform to track these metrics in real time, allowing businesses and investors to stay updated on their blockchain and crypto assets.
Key Features of the Blockchain & Cryptocurrency KPI Dashboard in Google Sheets
The Blockchain & Cryptocurrency KPI Dashboard is organized into six main worksheets, each with its specific function:
1. Dashboard Sheet Tab
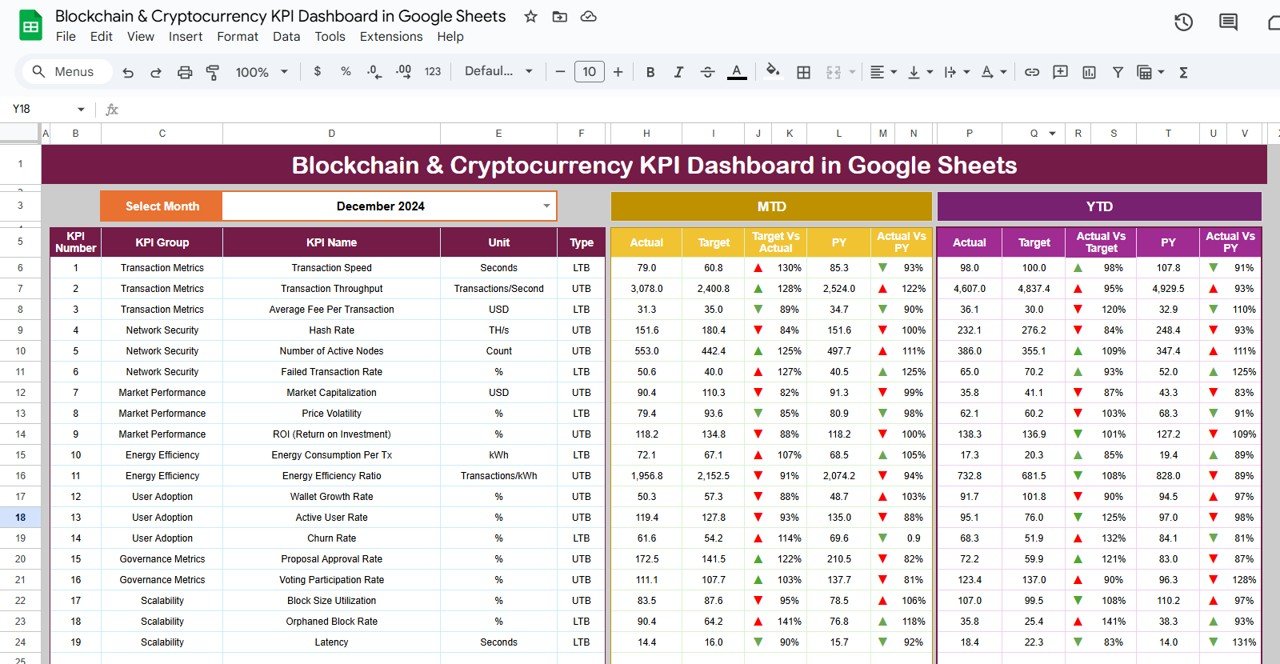
The Dashboard Sheet serves as the main page for displaying KPIs and performance metrics. It includes the following features:
Month Selection Dropdown (D3): Select the month you want to analyze. The dashboard will update automatically to display MTD (Month-to-Date) and YTD (Year-to-Date) data for that month.
Key Metrics:
- MTD Actual, Target, Previous Year Data: Compare actual data with the target and previous year’s data for the selected month.
- YTD Actual, Target, Previous Year Data: Track year-to-date performance and compare it to the target and previous year’s data.
Conditional Formatting: The dashboard uses up and down arrows to indicate whether the actual performance meets the target for both MTD and YTD metrics.
Click to buy Blockchain & Cryptocurrency KPI Dashboard in Google Sheets
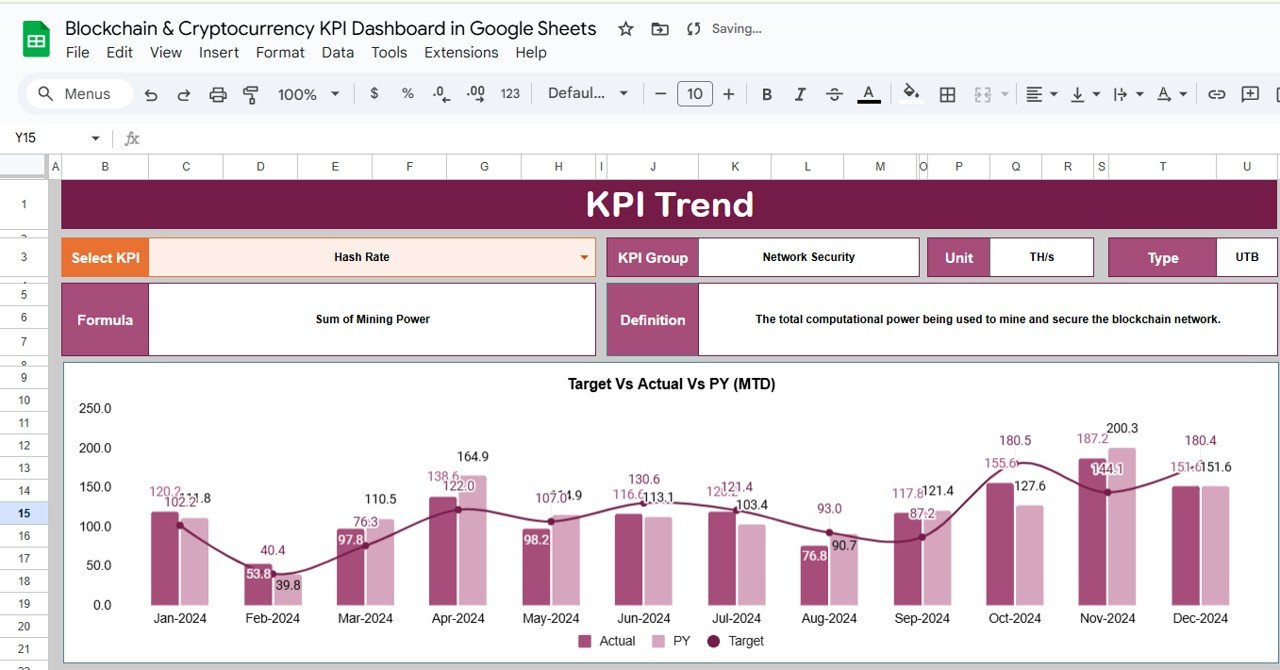
2. KPI Trend Sheet Tab
The KPI Trend Sheet enables you to analyze the performance of specific KPIs over time:
-
KPI Selection Dropdown (C3): Select a KPI from the dropdown list to view its historical performance.
-
KPI Group, Unit, and Type: Displays the KPI group (e.g., transaction volume, wallet growth), the unit of measurement, and whether the KPI is “Lower the Better” (LTB) or “Upper the Better” (UTB).
-
Formula and Definition: Provides the formula for calculating the KPI, along with its detailed definition.
Click to buy Blockchain & Cryptocurrency KPI Dashboard in Google Sheets
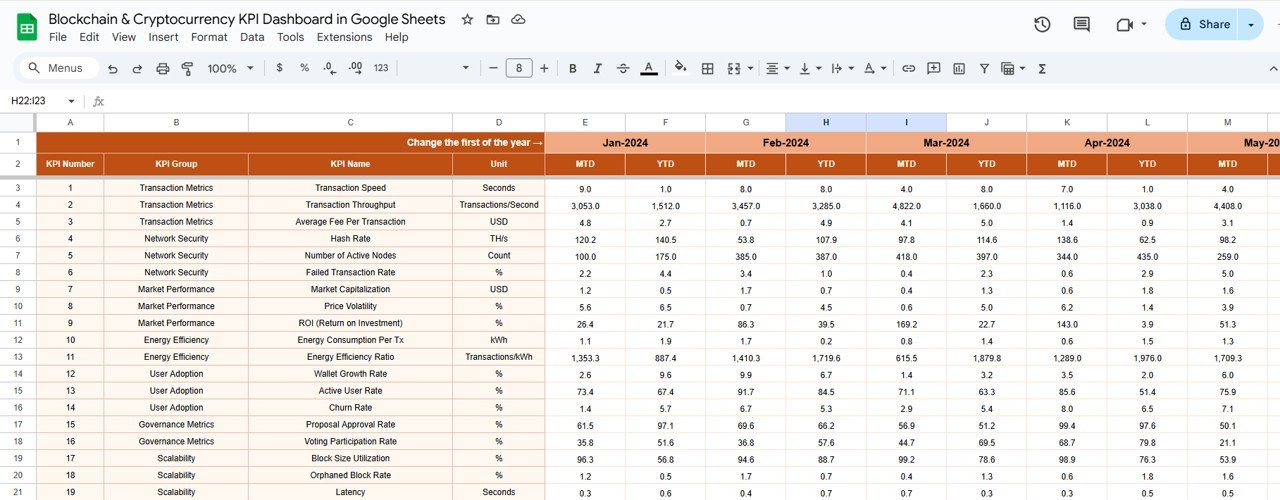
3. Actual Numbers Sheet Tab
The Actual Numbers Sheet is where you input actual data for the KPIs:
-
YTD and MTD Input: Enter the actual values for each KPI for both month-to-date and year-to-date metrics.
-
Dynamic Month Selection (E1): Select the first month of the year, and the data will automatically adjust to show the relevant numbers for that period.
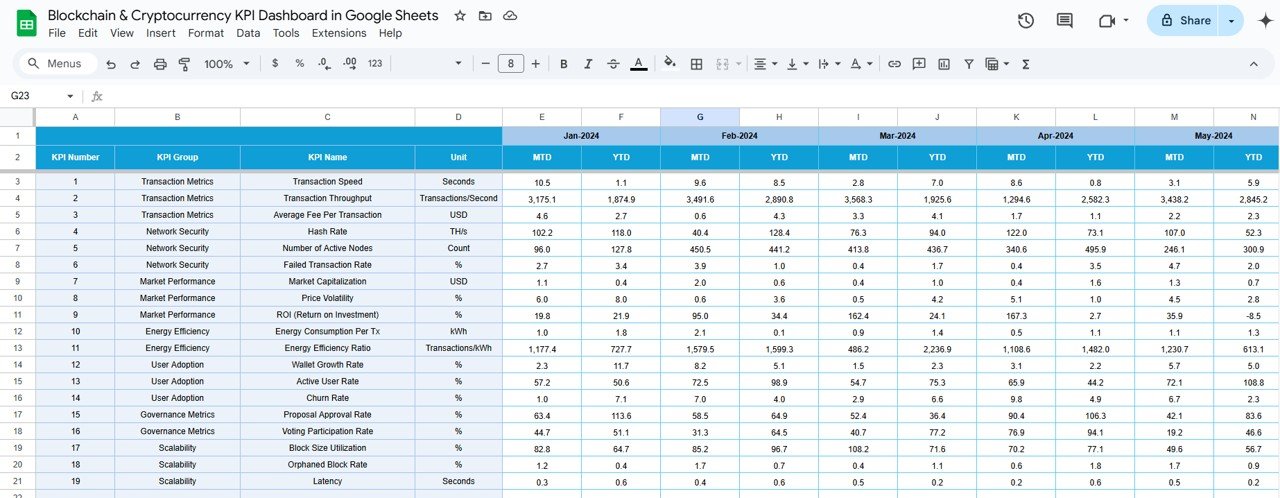
4. Target Sheet Tab
In the Target Sheet, you enter the target values for each KPI:
-
Monthly and YTD Targets: Input the target numbers for each KPI for both MTD and YTD performance, which will be compared against the actual numbers.
Click to buy Blockchain & Cryptocurrency KPI Dashboard in Google Sheets
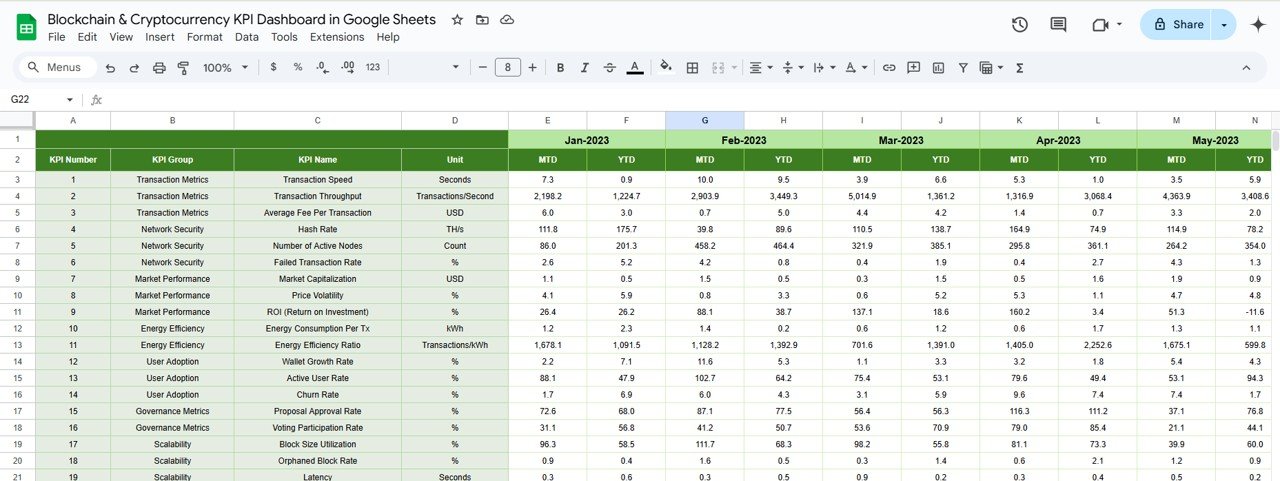
5. Previous Year Number Sheet Tab
This sheet is where you input the data from the previous year:
-
Historical Comparison: Enter the previous year’s data for comparison, allowing you to assess whether you are improving year-over-year.
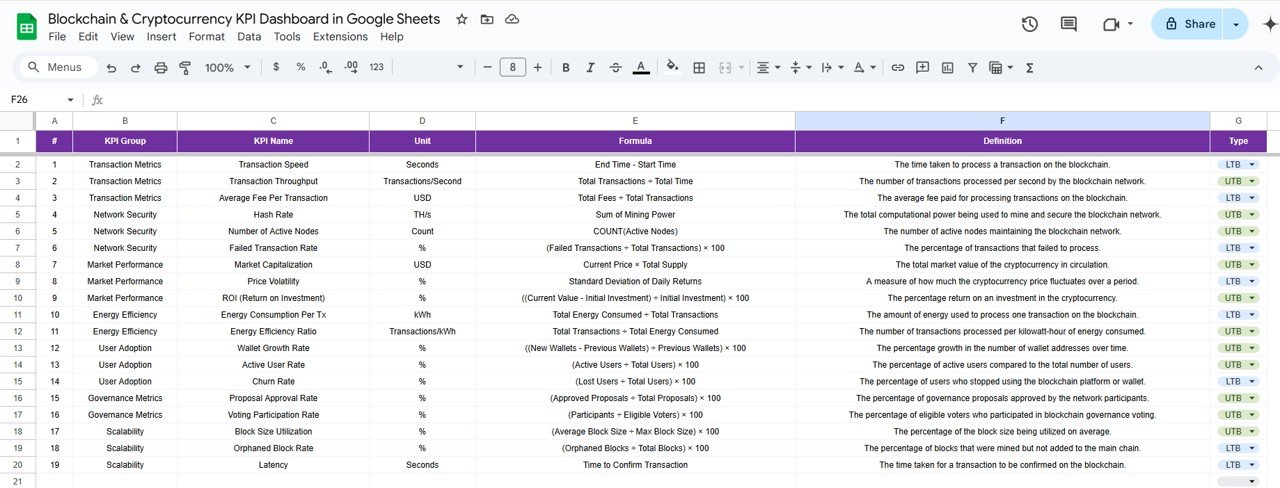
6. KPI Definition Sheet Tab
The KPI Definition Sheet helps you define each KPI clearly:
-
KPI Name, Group, Unit: Define the name, group, and unit of measurement for each KPI.
-
Formula and Definition: Include the formula used to calculate the KPI and provide a detailed explanation of what the KPI measures.
Click to buy Blockchain & Cryptocurrency KPI Dashboard in Google Sheets
Advantages of Using the Blockchain & Cryptocurrency KPI Dashboard
The Blockchain & Cryptocurrency KPI Dashboard provides several advantages:
-
Real-Time Insights: The dashboard offers real-time updates on your cryptocurrency performance, allowing you to stay on top of key metrics.
-
Informed Decision-Making: By tracking essential KPIs, you can make data-driven decisions that improve your blockchain operations and investments.
-
Customizable: The template is customizable, enabling you to track additional KPIs or adjust the layout to fit your needs.
-
Data Visualization: Visualizations such as charts and conditional formatting help you quickly understand performance trends.
-
Ease of Use: The Google Sheets platform makes it easy to use and share, even for those with minimal technical experience.
Opportunity for Improvement in the Blockchain & Cryptocurrency KPI Dashboard
While the Blockchain & Cryptocurrency KPI Dashboard is a powerful tool, there are areas where it could be enhanced:
-
Integration with Blockchain Platforms: Integrating the dashboard with blockchain platforms or APIs can automate data collection and improve accuracy.
-
Predictive Analytics: Adding predictive analytics could help forecast future trends in transaction volume, coin prices, and wallet growth, allowing for more proactive decision-making.
-
Mobile Accessibility: Developing a mobile version of the dashboard would enable you to access key metrics on the go.
-
Security Metrics: Including additional KPIs related to network security (e.g., attack attempts, system vulnerabilities) would provide a more comprehensive view of blockchain performance.
Best Practices for Using the Blockchain & Cryptocurrency KPI Dashboard
Click to buy Blockchain & Cryptocurrency KPI Dashboard in Google Sheets
To get the most out of the Blockchain & Cryptocurrency KPI Dashboard, consider these best practices:
-
Update Data Regularly: Regularly update the actual data for MTD and YTD metrics to keep the dashboard accurate and up-to-date.
-
Focus on Key KPIs: Track the most important KPIs for your specific blockchain or cryptocurrency goals, such as transaction volume and wallet growth.
-
Monitor Trends: Use the KPI Trend Sheet to analyze historical trends and spot emerging patterns.
-
Set Realistic Targets: Ensure that your KPIs are aligned with realistic targets that reflect your blockchain or cryptocurrency goals.
-
Collaborate with Your Team: Share the dashboard with team members or investors to ensure everyone is aligned on performance goals.
Conclusion
The Blockchain & Cryptocurrency KPI Dashboard in Google Sheets is an essential tool for monitoring and analyzing blockchain and cryptocurrency performance. By tracking KPIs like transaction volume, coin market capitalization, and wallet growth, you can gain valuable insights into your investments and blockchain operations. This dashboard helps you stay informed, make data-driven decisions, and optimize your blockchain performance for long-term success.
Frequently Asked Questions (FAQs)
Click to buy Blockchain & Cryptocurrency KPI Dashboard in Google Sheets
1. What KPIs does the Blockchain & Cryptocurrency KPI Dashboard track?
The dashboard tracks KPIs like transaction volume, coin price, market capitalization, wallet growth, mining hash rate, and more.
2. How do I update the Blockchain & Cryptocurrency KPI Dashboard?
You can update the dashboard by entering the actual data for MTD and YTD metrics, target numbers, and previous year’s data in the relevant sheets.
3. Can I customize the Blockchain & Cryptocurrency KPI Dashboard?
Yes, the dashboard is fully customizable. You can modify the KPIs, add new metrics, and adjust the layout to meet your specific needs.
4. How can I integrate the dashboard with blockchain platforms?
You can integrate the dashboard with blockchain platforms or APIs to automate data import and ensure accuracy.
5. How often should I update the data in the Blockchain & Cryptocurrency KPI Dashboard?
It’s recommended to update the dashboard regularly (e.g., weekly or monthly) to ensure it reflects the most current performance.
Visit our YouTube channel to learn step-by-step video tutorials
Youtube.com/@NeotechNavigators
Watch the step-by-step video Demo:
Click to buy Blockchain & Cryptocurrency KPI Dashboard in Google Sheets