Introduction
Broadcasting KPI Scorecard in Google Sheets is a ready-to-use template designed to help you efficiently track and analyze key performance indicators (KPIs) specific to the broadcasting industry. With its user-friendly interface and comprehensive data visualization, this scorecard enables quick insights into your broadcasting operations’ performance on a monthly, MTD, and YTD basis.
Key Features of Broadcasting KPI Scorecard in Google Sheets
- Four well-organized worksheets ensuring structured data management and visualization.
- Dropdown menus allowing easy selection of time periods such as Month-to-Date (MTD) and Year-to-Date (YTD).
- Clear comparison between Actual and Target values for each KPI for precise performance tracking.
- Color-coded visual indicators via conditional formatting to quickly identify KPI status.
- Comprehensive KPI overview with detailed contextual information including KPIs definitions, formulas, and grouping.
Dashboard Pages Explanation
1. Scorecard Sheet
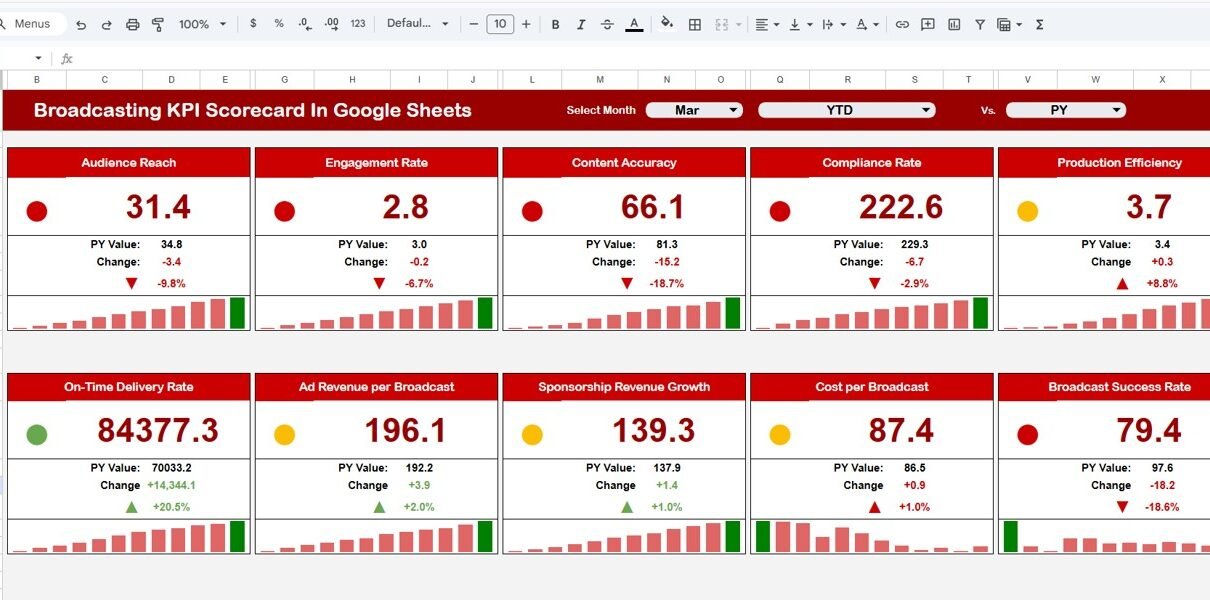
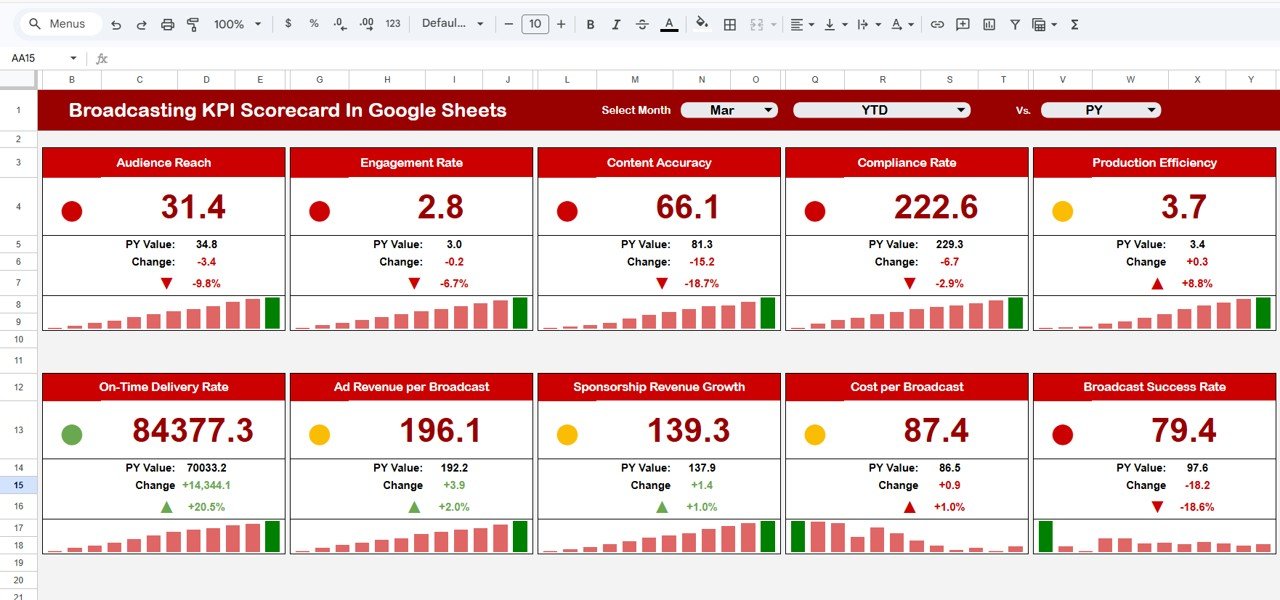
The Scorecard sheet acts as the primary dashboard where all KPI performances can be viewed at a glance.
 Broadcasting KPI Scorecard In Google Sheets
Click to Buy Broadcasting KPI Scorecard In Google Sheets
Key features of the Scorecard Sheet include:
- Dropdown Menus: Allows you to dynamically select the month and toggle between MTD and YTD views for performance comparison.
- Actual vs Target Values: Enables clear visualization of how your KPIs perform against their targets.
- Visual Indicators: Uses color-coded visuals for immediate detection of underperformance or success.
- Comprehensive KPI Overview: Presents all relevant KPI data, including MTD and YTD comparative metrics.
2. KPI Trend Sheet
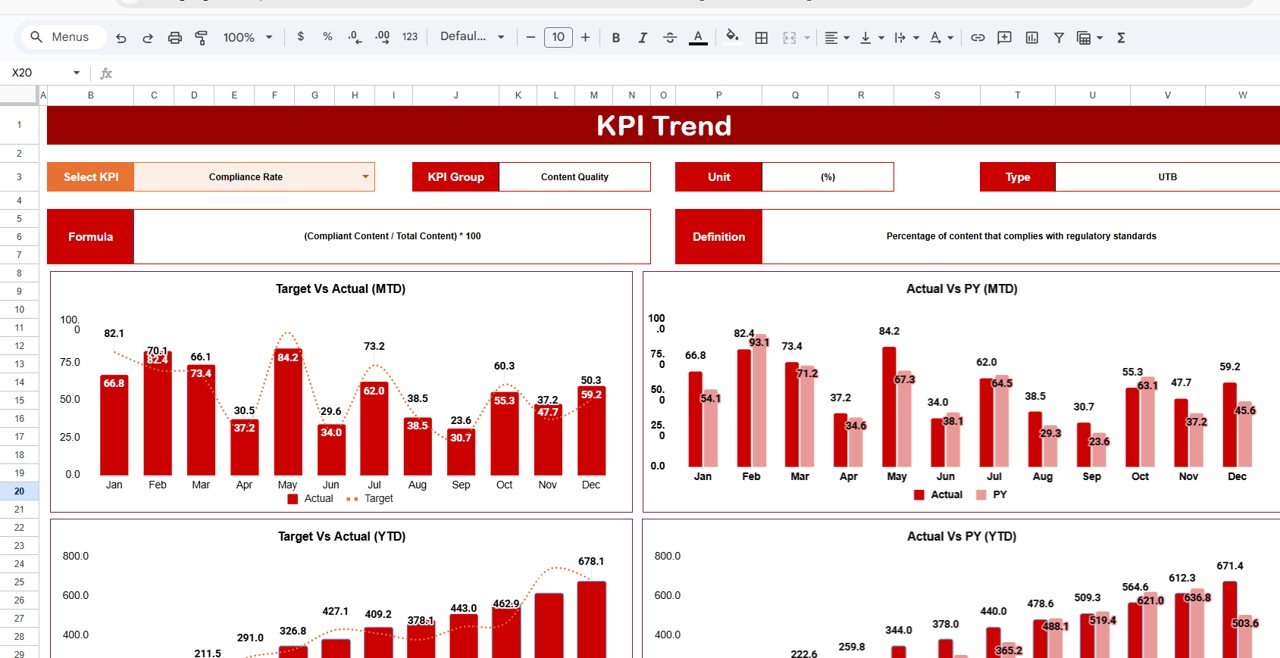
This sheet provides an in-depth analysis of individual KPI trends over time.
 KPI Trend Sheet
Click to Buy Broadcasting KPI Scorecard In Google Sheets
- KPI Selection: Use the dropdown at cell C3 to select the KPI you want to analyze.
- KPI Metadata: Displays KPI Group, Unit, KPI Type (whether lower or higher values are better), KPI Formula, and Definition.
- Trend Charts: Visualizes Month-to-Date and Year-to-Date performance trends for Actual, Target, and Prior Year (PY) data.
3. Input Data Sheet
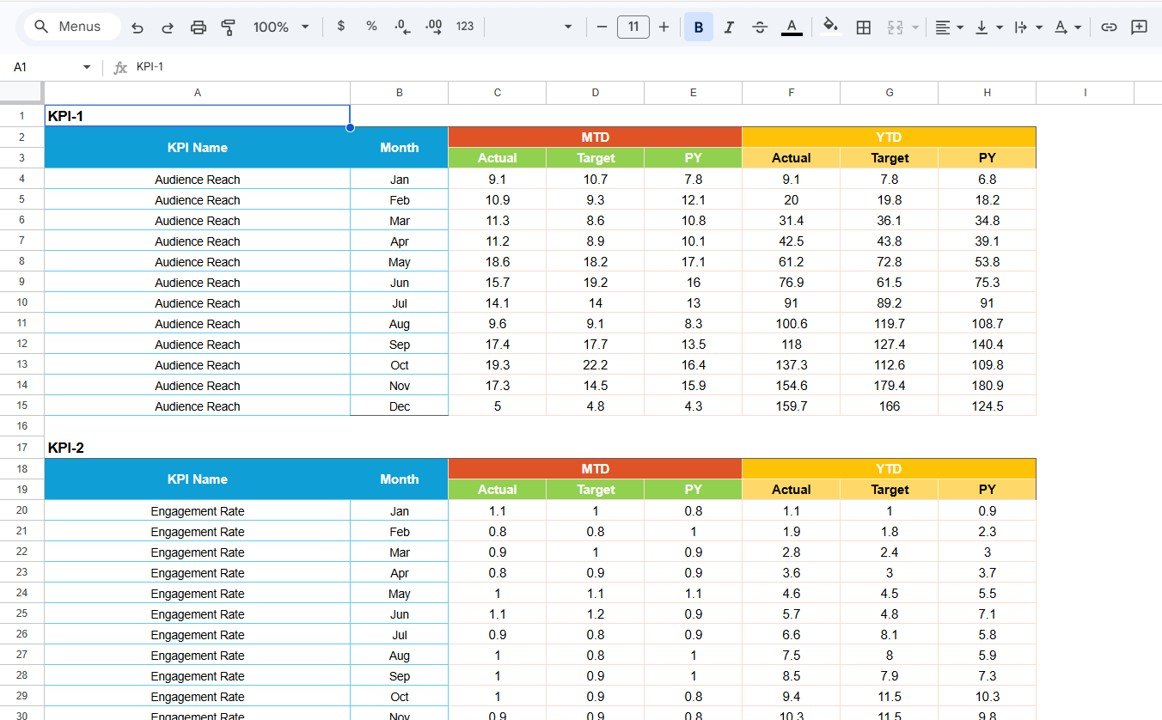
This sheet is your data entry point, ensuring all KPI data is accurately recorded and up-to-date.
 Input Data Sheet
Click to Buy Broadcasting KPI Scorecard In Google Sheets
- Data Entry: Record actual values, target goals, and other important metrics associated with each KPI.
- Flexibility: Easily update values as new KPIs results become available, maintaining the scorecard’s accuracy.
4. KPI Definition Sheet
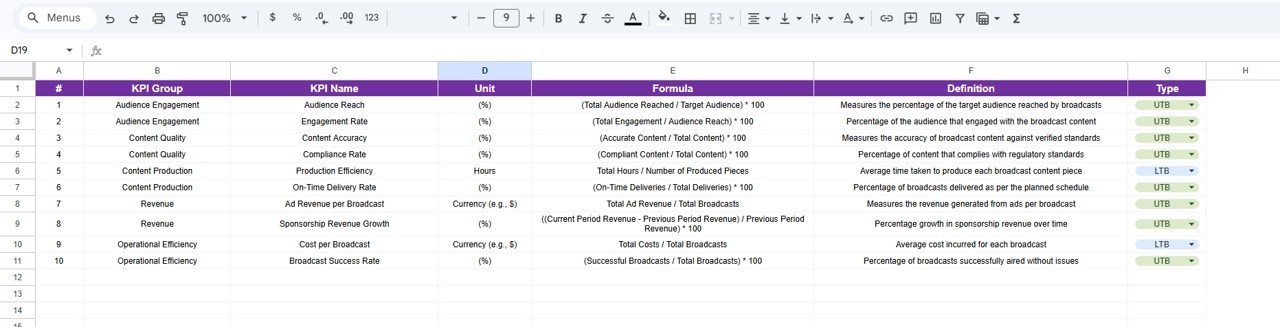
The KPI Definition sheet serves as the foundational reference for your scorecard KPIs.
 KPI Definition sheet tab
- Maintain the KPI Name, Group, Unit of measure, Formula, and a clear KPI Definition.
- Ensures consistency and helps all users understand what each KPI represents.
Advantages of Broadcasting KPI Scorecard in Google Sheets
- User-Friendly Interface: Intuitive layout enables users of all expertise levels to interact efficiently.
- Cloud-Based Accessibility: Utilize Google’s cloud environment for real-time collaboration and remote access.
- Customization: Easily modify KPIs and formulas to fit your specific broadcasting metrics.
- Visualization: Built-in conditional formatting and charts provide visual clarity of performance status.
- Comprehensive Reporting: View both granular and summarized data including MTD and YTD comparisons to spot trends.
Opportunities for Improvement
Click to Buy Broadcasting KPI Scorecard In Google Sheets
- Automation Enhancements: Integrate with Google Apps Script or external APIs for automated data input and alerts.
- Advanced Visualizations: Incorporate interactive dashboards with pivot tables or Google Data Studio integration.
- Mobile Optimization: Enhance usability on mobile devices for on-the-go KPI monitoring.
Best Practices
Click to Buy Broadcasting KPI Scorecard In Google Sheets
- Regular Data Updates: Keep data current by scheduling consistent data entry routines.
- Clear KPI Definitions: Ensure every stakeholder understands each KPI’s formula and relevance.
- Consistent Review: Periodically review targets and KPIs to align with your broadcasting strategic goals.
- Use Visual Indicators Wisely: Customize color thresholds to match your organization’s performance standards.
- Backup Your Scorecard: Regularly save backup copies to avoid accidental data loss.
FAQs
Click to Buy Broadcasting KPI Scorecard In Google Sheets
Can I customize the KPIs in this Broadcasting KPI Scorecard?
Yes, the template is fully customizable. You can add, remove, or modify KPIs as per your requirements on the KPI Definition sheet and Input Data sheet.
Is this scorecard suitable for other industries?
While designed specifically for broadcasting, the framework can be adapted for other industries by editing KPI definitions and data inputs.
Does the scorecard support collaboration?
Absolutely! Since it is developed in Google Sheets, multiple users can collaborate and update data simultaneously in real-time.
How do I interpret the visual indicators on the scorecard?
The color-coded visuals provide at-a-glance status of KPIs. Typically, green indicates meeting or exceeding targets, yellow for caution, and red alerts underperformance.
Conclusion
The Broadcasting KPI Scorecard in Google Sheets offers a comprehensive, easy-to-use solution for monitoring essential performance metrics within the broadcasting sector. Its flexibility, visual clarity, and cloud-based nature make it an indispensable tool for teams looking to analyze trends, compare targets, and optimize operational efficiency.
By using this template, broadcasting professionals can streamline KPI tracking, enabling more informed decisions and improved results.
Explore further and enhance your KPI management by visiting official resources such as Google Docs Help Center for tips on Google Sheets.
Visit our YouTube channel to watch the demo.