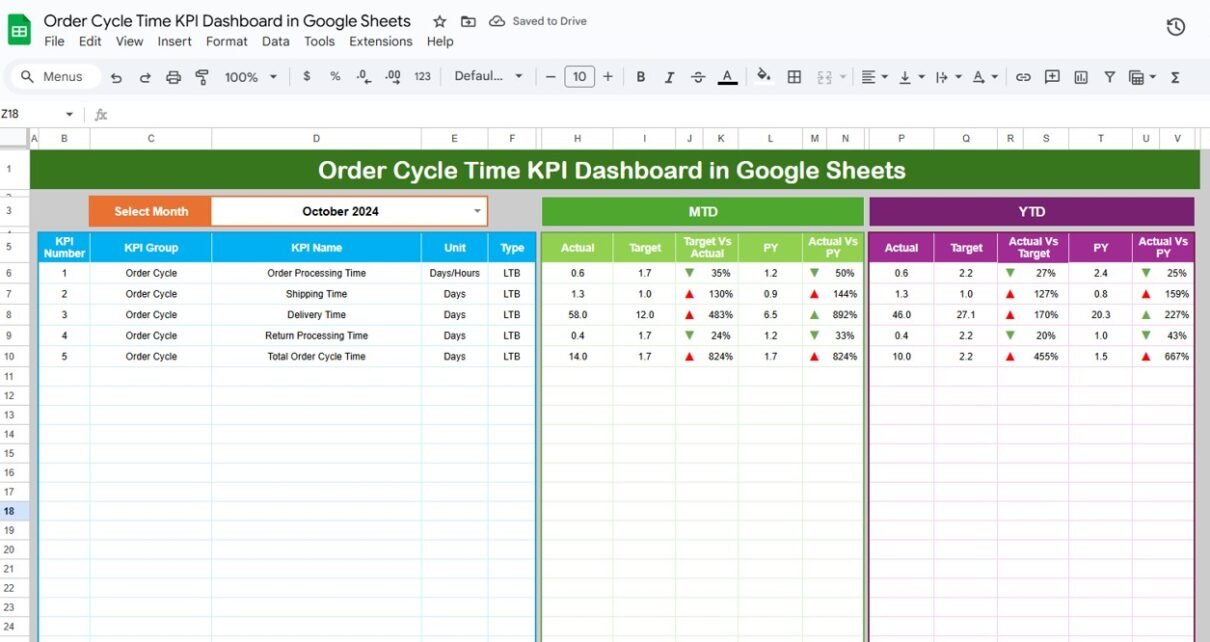
Managing order cycle time is one of the most important responsibilities in supply chain operations. When you measure order cycle time correctly, you understand how fast your business processes customer orders, how well your team handles delays, and how efficiently your supply chain performs from end to end. Today, many companies still track cycle times […]
KPI Dashboard
Google-Sheet-KPI-Dashboard
Freight Cost KPI Dashboard in Google Sheets
Managing freight costs remains one of the biggest challenges in logistics and supply chain operations. Transport rates change often, fuel prices rise without warning, and delays create additional expenses. When teams track this information manually, they struggle to identify trends, compare monthly performance, and take quick action. However, a Freight Cost KPI Dashboard in Google […]
Order Fulfillment KPI Dashboard in Google Sheets
Order fulfillment plays a critical role in supply chain efficiency, customer satisfaction, and business growth. When orders are delayed, partially fulfilled, or processed inaccurately, it affects customer trust and increases operational costs. To avoid these issues, businesses must continuously measure order performance using well-defined KPIs. The Order Fulfillment KPI Dashboard in Google Sheets provides a […]
Logistics Cost Optimization KPI Dashboard in Google Sheets
Managing Logistics Cost Optimization KPI Dashboard in Google Sheets costs is one of the most important priorities for supply chain, procurement, warehousing, and distribution teams. When transport costs rise, warehouse efficiency drops, or order accuracy suffers, the entire supply chain becomes expensive and inefficient. To reduce cost leaks, improve productivity, and strengthen operational visibility, organizations […]
Customer Loyalty KPI Dashboard in Google Sheets
Customer loyalty plays a critical role in business growth. Loyal customers return regularly, spend more, trust the brand, promote it organically, and create long-term value. To measure this effectively, organizations need a structured way to track loyalty metrics month over month and year over year.Customer Loyalty KPI Dashboard in Google Sheets The Customer Loyalty KPI […]
Data Center KPI Dashboard in Google Sheets
Data centers are the backbone of digital infrastructure, supporting everything from enterprise applications to cloud services. To operate efficiently, safely, and reliably, data centers must monitor key performance indicators (KPIs) related to uptime, energy efficiency, cooling performance, asset usage, and service quality.Data Center KPI Dashboard in Google Sheets The Data Center KPI Dashboard in Google […]
Power Grid KPI Dashboard in Google Sheets
Power grid operations demand extremely high reliability, efficient transmission, minimal outages, and safety. To achieve this, power grid companies must monitor critical KPIs (Key Performance Indicators) that reflect system performance, quality of supply, load management, and operational efficiency.Power Grid KPI Dashboard in Google Sheets The Power Grid KPI Dashboard in Google Sheets is a ready-to-use, […]
Electricity Distribution KPI Dashboard in Google Sheets
Managing electricity distribution requires accurate monitoring of supply quality, network efficiency, outages, energy losses, and operational performance. The Electricity Distribution KPI Dashboard in Google Sheets is a ready-to-use solution that helps utility companies track key metrics with automated charts, real-time comparisons, and detailed trend analysis.Electricity Distribution KPI Dashboard in Google Sheets This dashboard includes Monthly […]
Precious Metals KPI Dashboard in Google Sheets
The Precious Metals KPI Dashboard in Google Sheets is a dynamic, ready-to-use analytical tool designed to help precious metals traders, refiners, and manufacturers track performance across production, sales, pricing, quality, and operational efficiency.Precious Metals KPI Dashboard in Google Sheets From monitoring purity levels and refining yields to analyzing sales margins and inventory turnover, this dashboard […]
Industrial Safety KPI Dashboard in Google Sheets
In today’s industrial environment, safety performance is not just a compliance metric—it’s a key measure of operational excellence. The Industrial Safety KPI Dashboard in Google Sheets provides a smart, visual, and automated way to monitor critical safety indicators such as incident rates, near misses, training compliance, and corrective actions.Industrial Safety KPI Dashboard in Google Sheets […]


