Insurance companies and claims departments handle thousands of claims every year. Because customers expect fast and fair claim settlement, organizations must track claim performance accurately. However, many teams still depend on scattered spreadsheets, emails, and manual reports. As a result, claim delays increase, costs rise, and customer satisfaction drops.
A Claim Settlement KPI Dashboard in Google Sheets solves these challenges by providing a single, structured, and visual system to monitor the entire claim lifecycle. This ready-to-use dashboard helps insurers, TPAs, and claims teams track settlement speed, claim accuracy, backlog, costs, and customer satisfaction in real time.
In this article, we explain how the dashboard works, what KPIs it includes, how each worksheet functions, and how organizations can improve claim efficiency using data-driven insights.
What Is a Claim Settlement KPI Dashboard in Google Sheets?
Click to Buy Claim Settlement KPI Dashboard in Google Sheets
A Claim Settlement KPI Dashboard is a performance monitoring tool that tracks how efficiently claims move from submission to final settlement. It converts raw claim data into meaningful KPIs, comparisons, and trends.
Because this dashboard runs in Google Sheets, it offers:
-
Real-time updates
-
Easy collaboration
-
No expensive software
-
Automated calculations
-
Clear MTD and YTD analysis
Claims managers use this dashboard to reduce settlement time, control claim costs, and improve customer trust.
Key Worksheets in the Claim Settlement KPI Dashboard
The dashboard includes 6 structured worksheet tabs, each designed for a specific purpose.
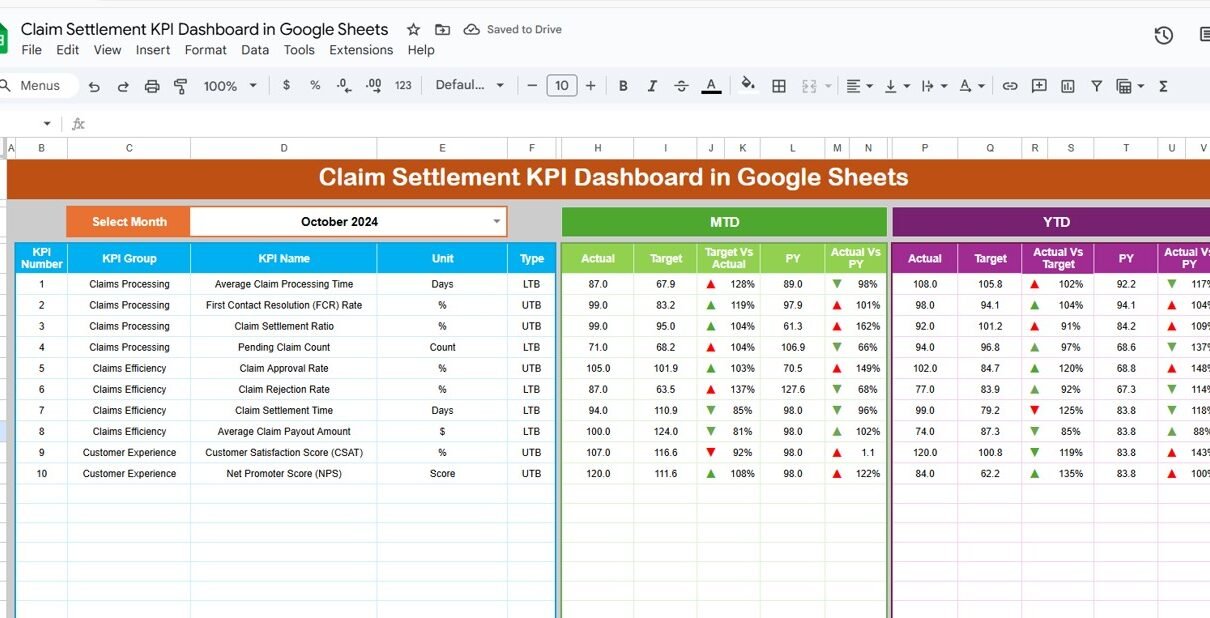
Dashboard Sheet Tab (Main Page)
This is the central view of the entire dashboard.
🔹 Month Selection
-
Select the month from cell D3
-
All KPI values update automatically for the selected month
🔹 Metrics Displayed
The dashboard shows:
MTD (Month-to-Date)
-
MTD Actual
-
MTD Target
-
MTD Previous Year
-
Target vs Actual
-
PY vs Actual
YTD (Year-to-Date)
-
YTD Actual
-
YTD Target
-
YTD Previous Year
-
Target vs Actual
-
PY vs Actual
🔹 Visual Indicators
-
Green arrow → positive performance
-
Red arrow → negative performance
This allows leadership to understand claim performance instantly.

Click to Buy Claim Settlement KPI Dashboard in Google Sheets
KPI Trend Sheet Tab
In this sheet, users select a KPI name from the dropdown in cell C3.
The sheet displays:
-
KPI Group
-
KPI Unit
-
KPI Type (Lower the Better / Upper the Better)
-
KPI Formula
-
KPI Definition
It also shows month-wise trends to analyze improvement or decline.

Click to Buy Claim Settlement KPI Dashboard in Google Sheets
Actual Number Sheet Tab
This sheet stores:
-
MTD Actual values
-
YTD Actual values
You select the first month of the year in cell E1, and the layout adjusts automatically.
This sheet acts as the primary data input source.

Target Sheet Tab
This sheet contains:
-
Monthly targets (MTD)
-
Annual targets (YTD)
Targets help teams measure whether claim performance meets business expectations.

Click to Buy Claim Settlement KPI Dashboard in Google Sheets
Previous Year Number Sheet Tab
This sheet stores previous year data for all KPIs.
It supports year-over-year performance comparison and long-term trend analysis.

KPI Definition Sheet Tab
This is the reference sheet for all KPIs. It contains:
-
KPI Name
-
KPI Group
-
Unit
-
Formula
-
KPI Definition
-
KPI Type (LTB / UTB)
This sheet ensures consistency and clarity across teams.

Click to Buy Claim Settlement KPI Dashboard in Google Sheets
Advantages of the Claim Settlement KPI Dashboard
-
Faster claim settlement decisions
-
Improved SLA compliance
-
Better cost control
-
Reduced claim backlog
-
Higher customer satisfaction
-
Transparent performance tracking
-
Easy audits and reporting
Opportunities for Improvement in Claim Settlement Tracking
-
Integrate claims systems (CRM / Core Insurance System)
-
Add automated SLA alerts
-
Include severity-based claim scoring
-
Track claim aging buckets
-
Introduce predictive fraud analytics
Best Practices for Using the Dashboard
Click to Buy Claim Settlement KPI Dashboard in Google Sheets
-
Update claim data daily
-
Review SLA KPIs weekly
-
Set realistic but challenging targets
-
Monitor high-value claims closely
-
Train teams on KPI definitions
-
Use trend analysis for continuous improvement
Conclusion
A Claim Settlement KPI Dashboard in Google Sheets empowers insurance and claims teams to manage claims efficiently, reduce settlement delays, and improve customer trust. With structured KPIs, automated calculations, and clear visuals, this dashboard becomes a powerful operational and strategic tool. Because it is easy to use and highly flexible, organizations of all sizes can adopt it quickly and improve claim performance consistently.
Frequently Asked Questions (FAQs)
Click to Buy Claim Settlement KPI Dashboard in Google Sheets
1. Who should use this dashboard?
Insurance companies, TPAs, claim processing teams, and risk managers.
2. Can I add more KPIs?
Yes, the KPI Definition sheet allows easy customization.
3. Does it support monthly and yearly tracking?
Yes, it includes both MTD and YTD views.
4. Is Google Sheets secure for claims data?
Yes, with proper access controls and permissions.
5. Can this dashboard support audits?
Yes, it provides structured and traceable performance data.
Visit our YouTube channel to learn step-by-step video tutorials
Youtube.com/@NeotechNavigators
Watch the step-by-step video tutorial:
Click to Buy Claim Settlement KPI Dashboard in Google Sheets