Understanding client satisfaction is critical for business growth and retention. The Client Satisfaction Survey Dashboard in Google Sheets is a ready-to-use tool that consolidates survey responses, tracks key satisfaction metrics, and provides actionable insights.
In this article, we will explain the features, advantages, and best practices for using this dashboard to monitor client satisfaction effectively.Client Satisfaction Survey Dashboard in Google Sheets
What Is a Client Satisfaction Survey Dashboard in Google Sheets?
A Client Satisfaction Survey Dashboard is an interactive tool designed to track feedback from clients across multiple parameters. It helps businesses measure satisfaction, service quality, communication effectiveness, and Net Promoter Score (NPS) to improve client relationships.
With Google Sheets, this dashboard is accessible, collaborative, and easy to update, making it ideal for customer service and account management teams.
Key Features of the Client Satisfaction Survey Dashboard in Google Sheets
Click to Buy Client Satisfaction Survey Dashboard in Google Sheets
This dashboard includes multiple sheet tabs to provide comprehensive insights:
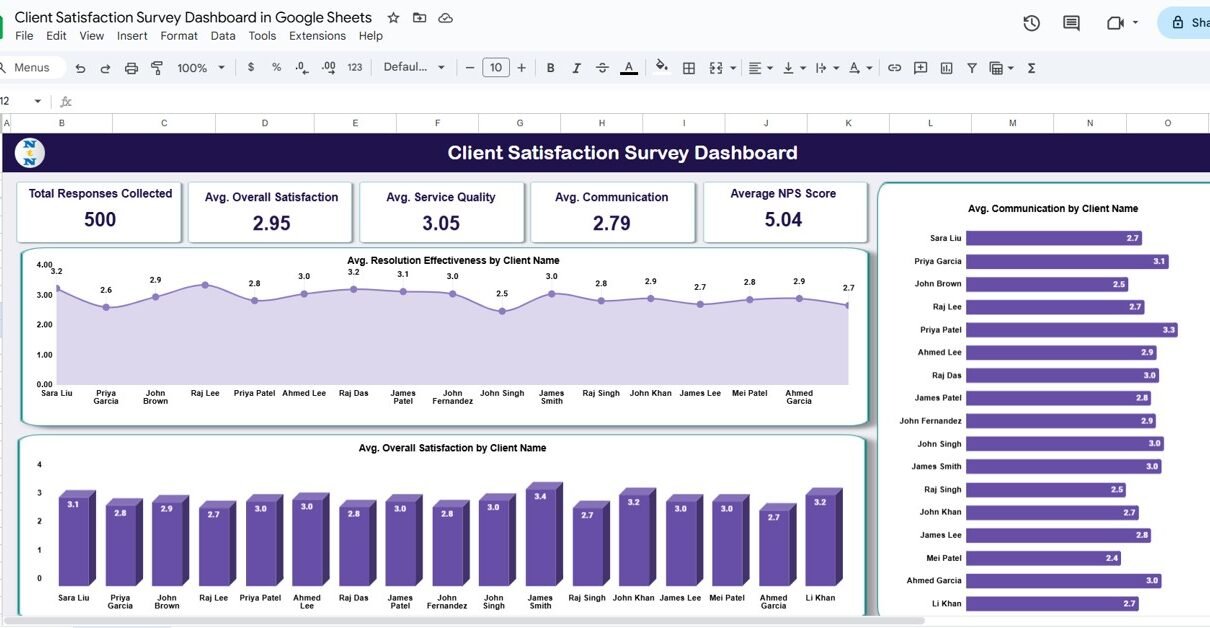
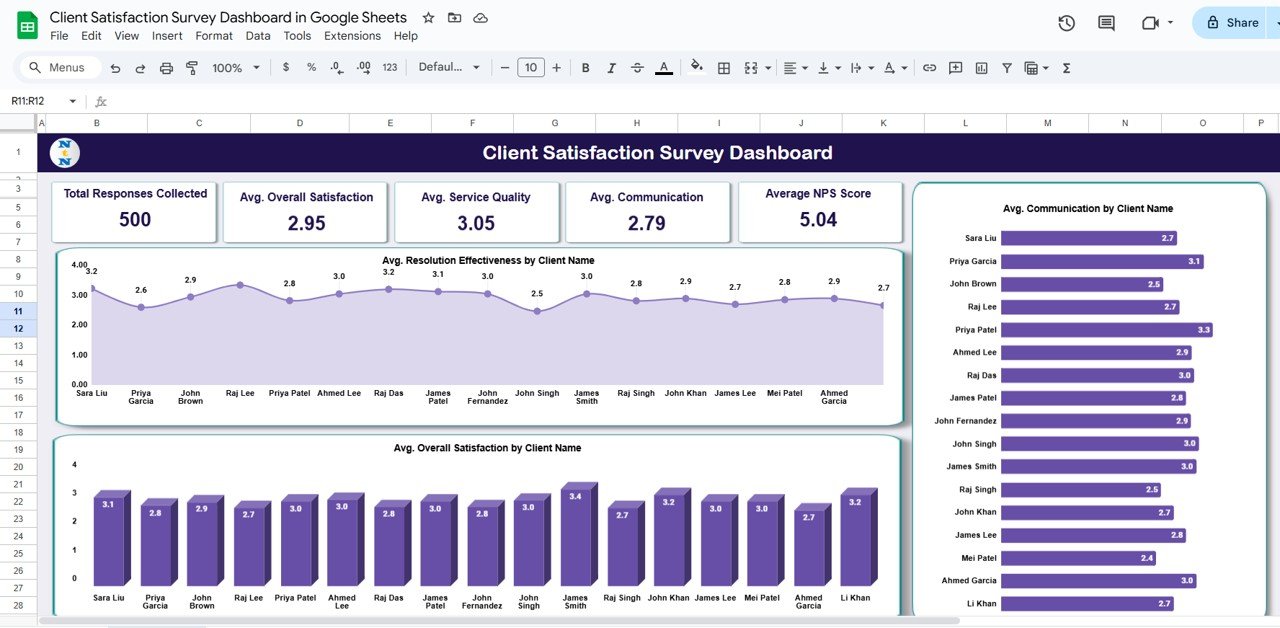
1. Overview Sheet Tab
The Overview sheet offers a summary of all survey metrics using cards and charts.
Cards:
-
Total Responses Collected – Number of client survey responses
-
Avg. Overall Satisfaction – Average satisfaction score across all clients
-
Avg. Service Quality – Average score for service performance
-
Avg. Communication – Average communication rating
-
Average NPS Score – Net Promoter Score indicating client loyalty
Charts:
-
Avg. Resolution Effectiveness by Client Name – Measures how efficiently client issues are resolved
-
Avg. Overall Satisfaction by Client Name – Tracks satisfaction for each client
-
Avg. Communication by Client Name – Displays communication ratings by client
Click to Buy Client Satisfaction Survey Dashboard in Google Sheets
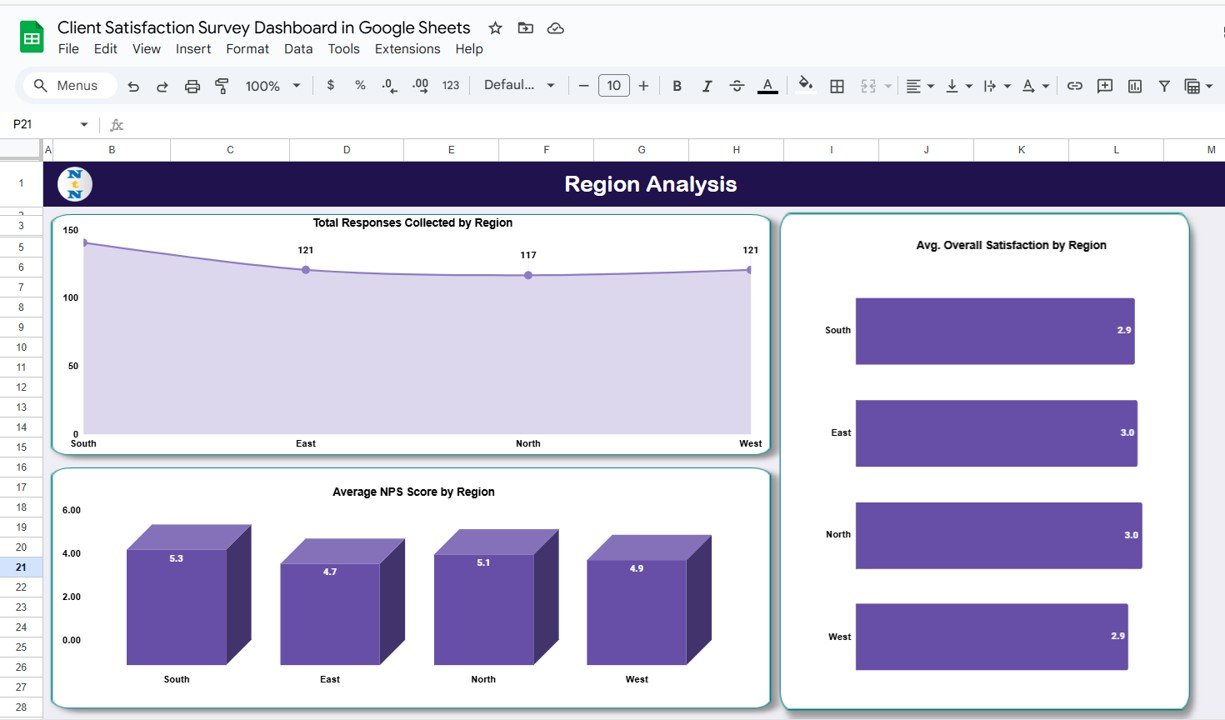
2. Region Analysis Sheet Tab
This sheet provides insights by geographic regions.
Charts:
-
Total Responses Collected by Region – Volume of survey responses per region
-
Avg. Overall Satisfaction by Region – Regional satisfaction trends
-
Average NPS Score by Region – Measures loyalty and likelihood to recommend
Regional analysis helps identify areas with high or low client satisfaction for targeted improvement.
Click to Buy Client Satisfaction Survey Dashboard in Google Sheets
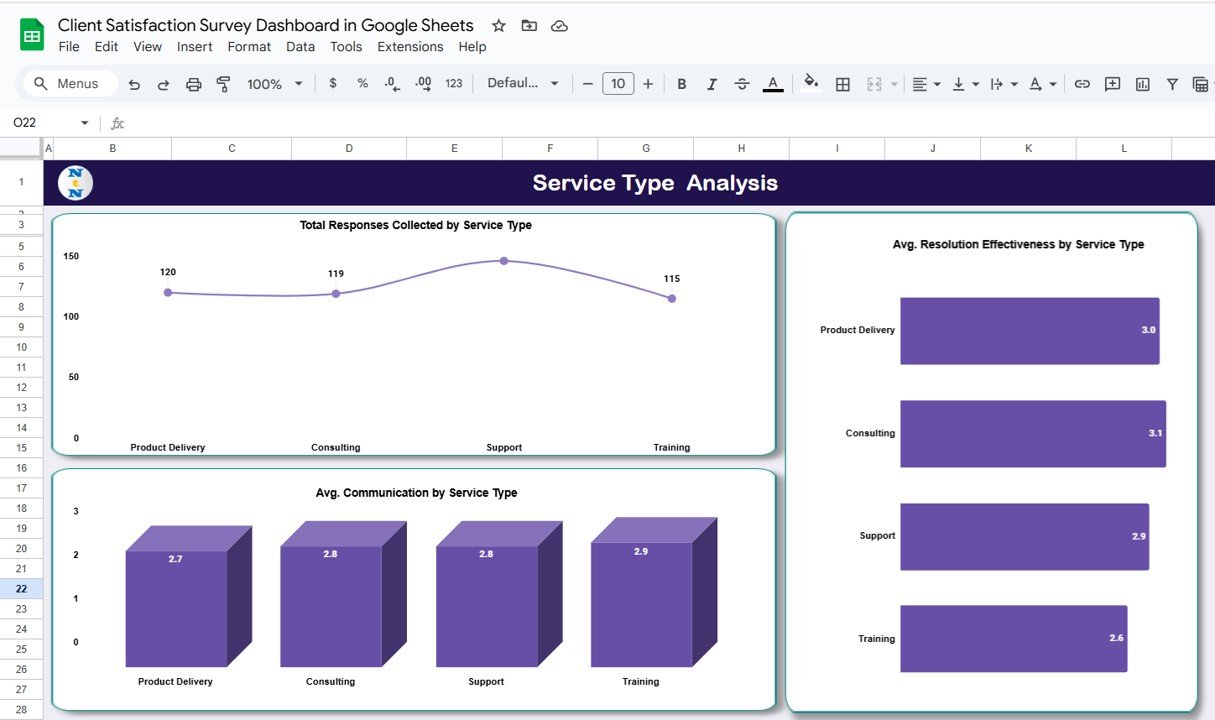
3. Service Type Analysis Sheet Tab
This sheet evaluates satisfaction based on service categories.
Charts:
-
Total Responses Collected by Service Type – Survey volume per service
-
Avg. Resolution Effectiveness by Service Type – Effectiveness of different service types
-
Avg. Communication by Service Type – Communication performance across services
This helps businesses assess which service types perform well and which require improvement.
Click to Buy Client Satisfaction Survey Dashboard in Google Sheets
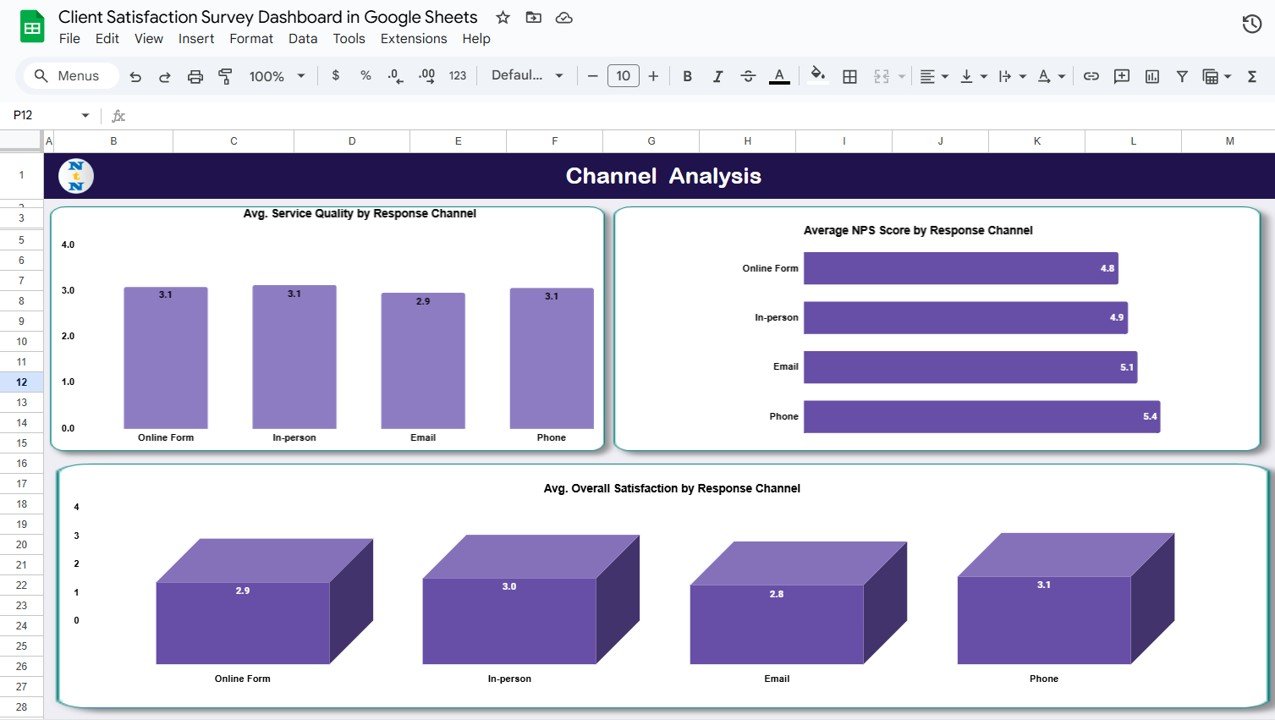
4. Channel Analysis Sheet Tab
The Channel Analysis sheet tracks satisfaction by response channels.
Charts:
-
Avg. Service Quality by Response Channel – Quality ratings per channel
-
Average NPS Score by Response Channel – Loyalty score by channel
-
Avg. Overall Satisfaction by Response Channel – Client satisfaction per communication channel
This helps determine which channels provide the best client experience.
Click to Buy Client Satisfaction Survey Dashboard in Google Sheets
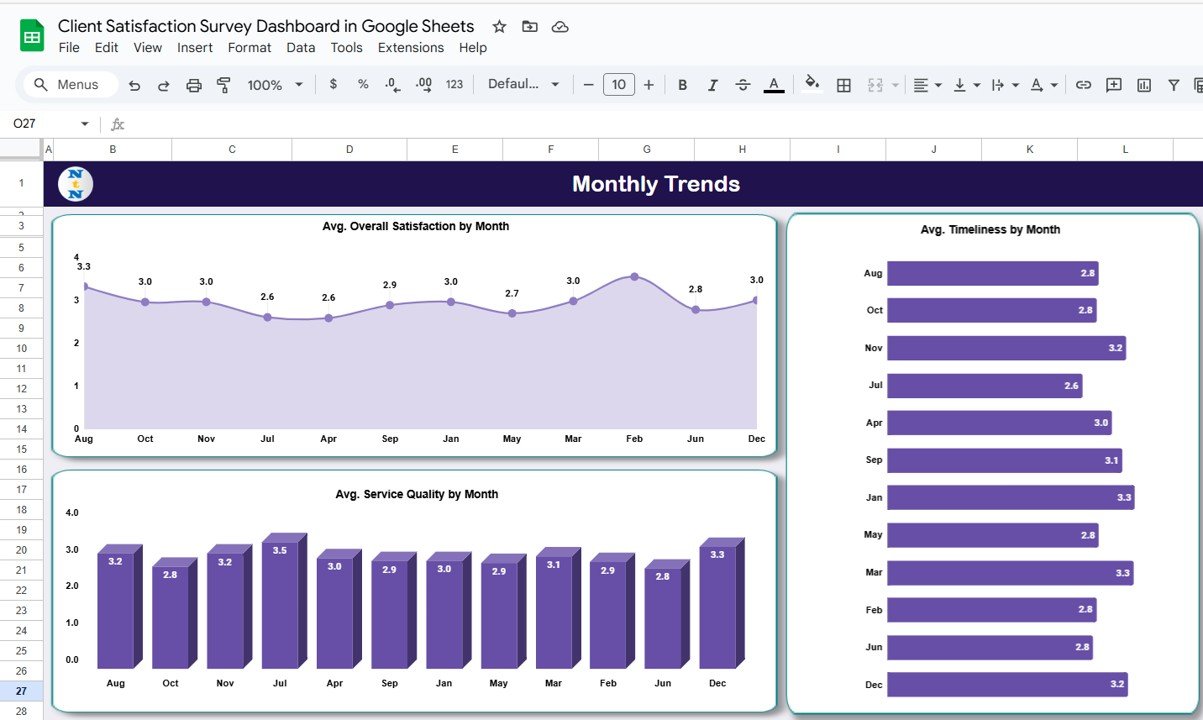
5. Monthly Trends Sheet Tab
The Monthly Trends sheet tracks changes over time.
Charts:
-
Avg. Overall Satisfaction by Month – Trend of overall satisfaction
-
Avg. Service Quality by Month – Service performance over months
-
Avg. Timeliness by Month – Measures speed of service delivery
Monthly trends help monitor improvements and seasonal variations in client satisfaction.
Click to Buy Client Satisfaction Survey Dashboard in Google Sheets
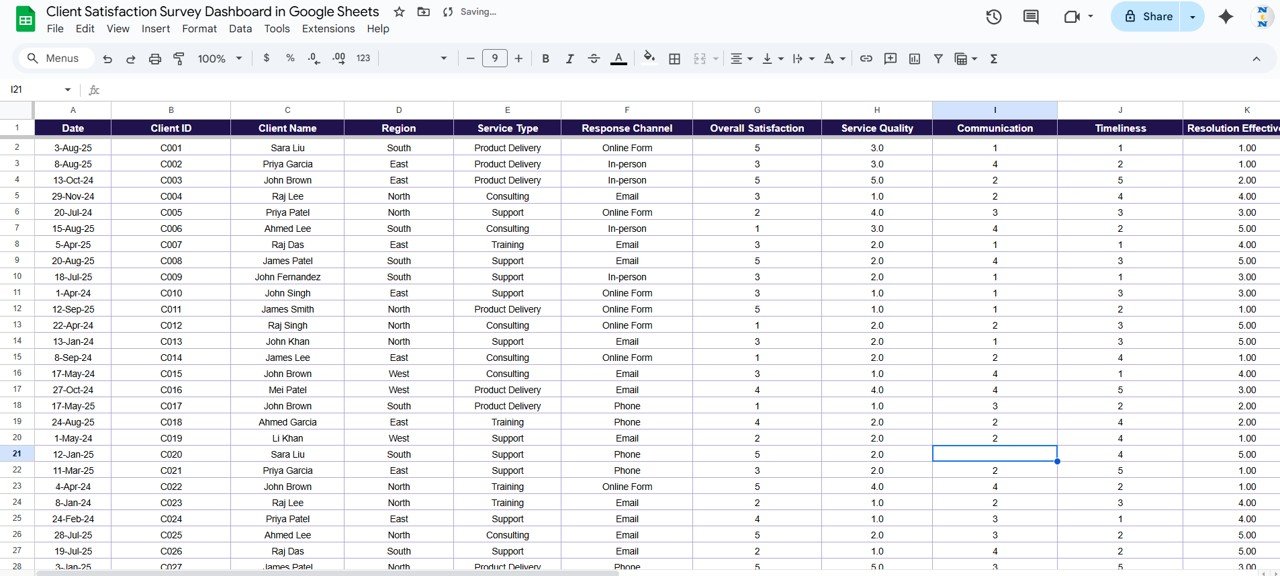
6. Data and Search Sheet Tabs
-
Data Sheet Tab: The central repository where all survey responses are recorded, including client information, ratings, service type, region, and channel.
-
Search Sheet Tab: Allows searching by keyword and field name to quickly locate specific survey responses or client feedback.
Structured data input ensures accurate dashboards and reliable reporting.
Click to Buy Client Satisfaction Survey Dashboard in Google Sheets
Advantages of Using the Client Satisfaction Dashboard
-
Centralized Insights: All survey metrics in one dashboard
-
Data-Driven Decisions: Identify areas for improvement based on real client feedback
-
Trend Analysis: Monitor monthly and regional trends for proactive actions
-
Channel Performance Tracking: See which communication channels work best
-
Service Improvement: Evaluate resolution effectiveness and service quality
-
Customizable: Adjust metrics, fields, and charts according to your organization’s needs
Best Practices for Using the Dashboard
Click to Buy Client Satisfaction Survey Dashboard in Google Sheets
-
Update Data Regularly: Enter new survey responses promptly to keep dashboards accurate
-
Segment by Region, Service, or Channel: Analyze data for targeted insights
-
Track Trends Over Time: Use Monthly Trends to identify performance improvements or declines
-
Focus on Actionable Metrics: Pay attention to NPS, resolution effectiveness, and communication scores
-
Use Search Functionality: Quickly locate individual client feedback for follow-up or analysis
How This Dashboard Helps Businesses
-
Monitor Client Satisfaction: Track overall satisfaction, NPS, and feedback trends
-
Improve Service Delivery: Identify bottlenecks in resolution or communication
-
Allocate Resources Effectively: Focus on underperforming regions or service types
-
Enhance Client Retention: Take data-driven actions to improve satisfaction and loyalty
-
Support Management Decisions: Provide executives with clear, visual insights
Frequently Asked Questions (FAQs)
Click to Buy Client Satisfaction Survey Dashboard in Google Sheets
Q1: Can I customize this dashboard for my organization?
Yes, you can adjust metrics, charts, and filters to match your survey and client tracking needs.
Q2: How often should I update survey data?
Update the data as responses are collected; monthly updates help maintain accurate trend analysis.
Q3: Can I track satisfaction by service type and region simultaneously?
Yes, you can filter data and charts by both dimensions for detailed insights.
Q4: Does the dashboard support multiple response channels?
Absolutely. Channel Analysis allows you to track satisfaction per communication channel.
Q5: Can I monitor trends over time?
Yes, the Monthly Trends sheet provides visual insights into performance over months.
Conclusion
Click to Buy Client Satisfaction Survey Dashboard in Google Sheets
The Client Satisfaction Survey Dashboard in Google Sheets is a comprehensive tool for monitoring client satisfaction, service quality, and loyalty metrics. By consolidating data, providing visual insights, and tracking trends, businesses can make informed decisions to enhance customer experience, improve service delivery, and boost client retention.
Visit our YouTube channel to learn step-by-step video tutorials
Youtube.com/@NeotechNavigators
Watch the step-by-step video Demo:
Click to Buy Client Satisfaction Survey Dashboard in Google Sheets