In today’s fast-paced and ever-evolving business environment, tracking compliance is crucial for organizations of all sizes. Whether you’re monitoring regulatory adherence, internal policies, or industry standards, staying on top of compliance is vital to mitigating risks and ensuring a smooth operation. One of the most effective ways to track compliance is by using a Compliance KPI Dashboard.
A Compliance KPI Dashboard in Google Sheets is a user-friendly tool designed to track and visualize key performance indicators (KPIs) related to compliance. This article delves into the essential components of a Compliance KPI Dashboard, focusing on how it works in Google Sheets, and listing all relevant KPIs, including their unit, formula, and how to aggregate the data effectively.
What is a Compliance KPI Dashboard?
A Compliance KPI Dashboard is a centralized tool used by businesses to track various compliance-related KPIs. It helps monitor the organization’s adherence to internal and external standards, policies, regulations, and laws. With Google Sheets, a Compliance KPI Dashboard becomes even more powerful by offering the flexibility to modify, track, and visualize real-time data while keeping the dashboard collaborative and accessible to multiple users.
Key Features of the Compliance KPI Dashboard in Google Sheets
The Compliance KPI Dashboard in Google Sheets comes equipped with six key worksheets that simplify compliance tracking and make data management seamless. Here’s an overview of the six worksheets included in the dashboard:
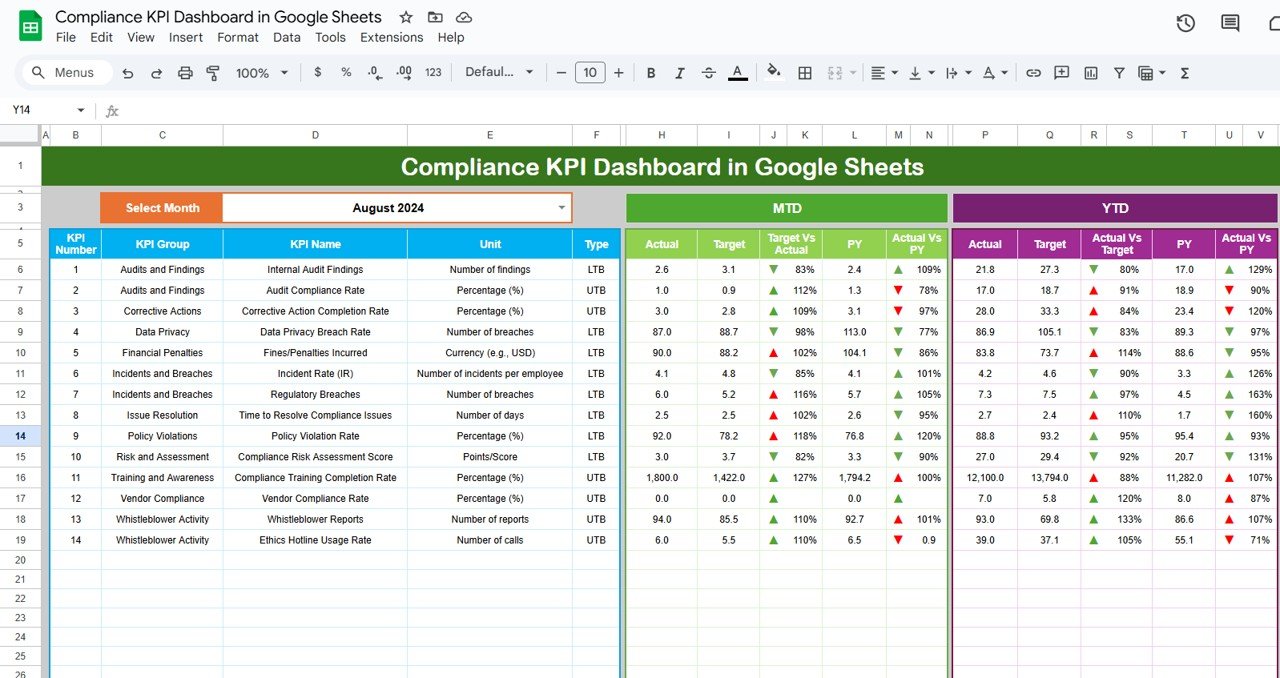
1. Dashboard Sheet Tab
This is the main sheet tab of the dashboard where you can view all the information about each KPI. The data here is interactive, allowing users to select the month using a dropdown (range D3). Based on this selection, all dashboard data will update automatically.
Key data points displayed include:
- MTD (Month-to-Date) Actuals
- Target
- Previous Year Data
- Target vs. Actual Comparison with conditional formatting (up/down arrows)
- YTD (Year-to-Date) Actuals, Target, and Previous Year Data with similar comparisons
Click to buy Compliance KPI Dashboard in Google Sheets
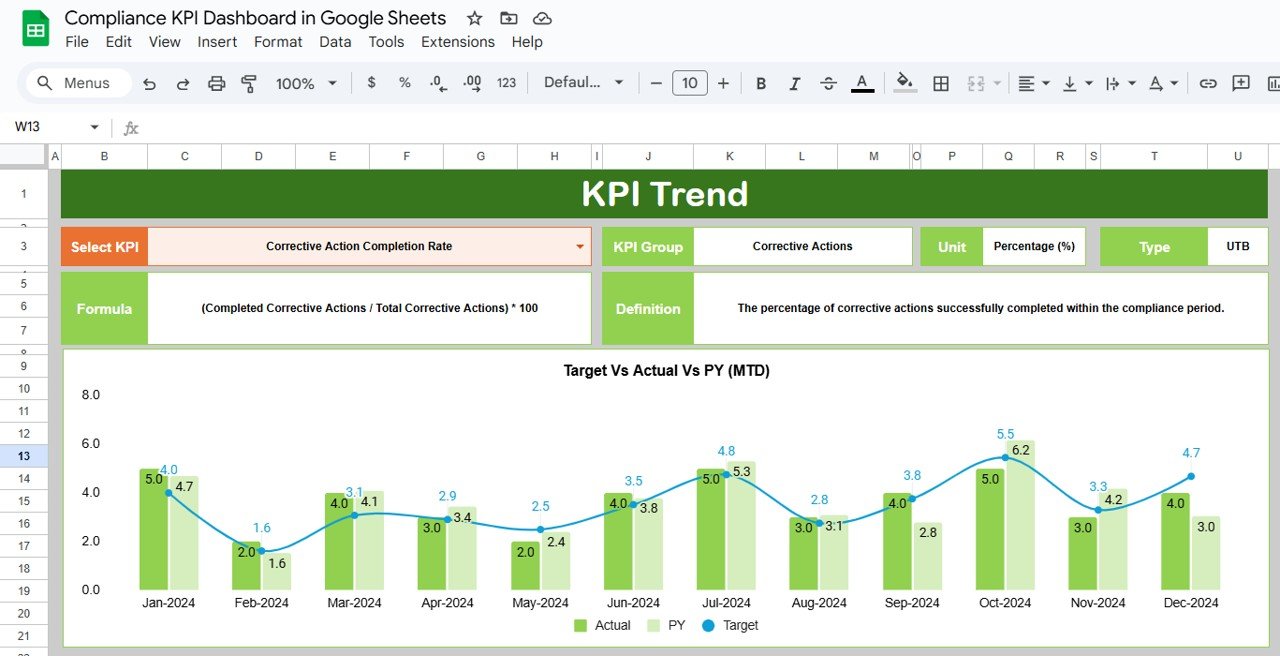
2. KPI Trend Sheet Tab
In this sheet, users can select a specific KPI from the dropdown menu (range C3). The following details are shown for each selected KPI:
- KPI Group
- Unit of Measurement
- Type of KPI (Lower the Better/Upper the Better)
- Formula for Calculating the KPI
- Definition of the KPI
Click to buy Compliance KPI Dashboard in Google Sheets
3. Actual Numbers Sheet Tab
This sheet allows you to input actual numbers for both YTD and MTD compliance data. The month can be adjusted from range E1, making it easy to switch between months and compare data accordingly.
4. Target Sheet Tab
Here, you can enter the target values for each KPI, both for MTD and YTD. This ensures that targets are aligned with compliance goals and progress is tracked effectively.
5. Previous Year Numbers Sheet Tab
This tab stores data from the previous year, making it easy to compare year-over-year performance and compliance progress.
6. KPI Definition Sheet Tab
This sheet is where the details of each KPI are outlined. You’ll find the KPI name, group, unit of measurement, formula, and a clear definition, making it easy to understand the relevance and purpose of each compliance metric.
List of Compliance KPIs in Google Sheets
To ensure the effectiveness of your compliance monitoring, it’s essential to define clear KPIs. Below is a comprehensive list of possible compliance KPIs, along with their unit of measurement, formula for aggregation, and whether “lower is better” or “upper is better.”
Advantages of Using a Compliance KPI Dashboard in Google Sheets
Using a Compliance KPI Dashboard in Google Sheets offers several advantages, making it a valuable tool for businesses of all sizes:
- Centralized Data Management; All compliance-related data is consolidated into one dashboard, ensuring that stakeholders can access real-time information quickly.
- Easy Customization: Google Sheets allows you to customize the dashboard according to your organization’s specific needs, such as adding or removing KPIs, adjusting formulas, and modifying the layout.
- Real-Time Collaboration: Google Sheets supports real-time collaboration, enabling teams to work together and update compliance data simultaneously from different locations.
- Cost-Effective Solution: Google Sheets is a free tool, making it a budget-friendly option for organizations that want to track compliance without investing in expensive software.
- Data Transparency: By providing clear, visually appealing charts and comparisons, the Compliance KPI Dashboard improves transparency in the organization’s compliance performance, helping teams and leadership stay on track.
Opportunities for Improvement in Compliance KPI Dashboards
While the Compliance KPI Dashboard in Google Sheets offers many benefits, there are always opportunities for improvement:
- Automated Data Integration: One opportunity for improvement is automating data imports. Instead of manually entering data, integrating with other tools or databases could automatically populate the dashboard, reducing human error.
- Advanced Data Visualizations: While Google Sheets allows for basic charting, enhancing the visual representations of KPIs with more dynamic charts and graphs can improve user experience and make data easier to interpret.
- Enhanced Security Measures: Adding more robust security features, such as password protection and access control for different team members, would further enhance the privacy and security of sensitive compliance data.
- Custom Alerts: Adding custom alert systems based on KPI performance thresholds could notify teams when certain compliance levels fall below or exceed preset limits, helping prevent issues before they escalate.
Best Practices for Using a Compliance KPI Dashboard
Click to buy Compliance KPI Dashboard in Google Sheets
To maximize the effectiveness of your Compliance KPI Dashboard in Google Sheets, follow these best practices:
- Regularly Update Data: Ensure that the data is updated regularly to reflect the most accurate and current information. This includes updating both actual numbers and targets.
- Set Clear, Achievable Target: It’s essential to define realistic and achievable compliance targets. Regularly review these targets to ensure they align with industry standards and regulatory requirements.
- Review the Dashboard Consistently: Make a habit of reviewing the dashboard at least once a month to monitor progress and make necessary adjustments. Share the dashboard with relevant stakeholders for collective decision-making.
- Provide Training on Using the Dashboard: Ensure that your team is well-trained on how to use the dashboard effectively. This includes understanding the KPIs, how to input data, and how to interpret the results.
- Leverage Conditional Formatting: Use conditional formatting to highlight areas of concern, such as compliance violations or delays, making it easier to spot issues at a glance.
Conclusion
Click to buy Compliance KPI Dashboard in Google Sheets
A Compliance KPI Dashboard in Google Sheets is an invaluable tool for businesses looking to monitor and manage compliance effectively. By tracking key performance indicators, setting clear targets, and leveraging Google Sheets’ flexibility, companies can stay on top of regulatory requirements and internal standards. Whether you’re a small business or a large enterprise, this dashboard offers an accessible and cost-effective way to manage compliance data in real-time.
By incorporating the best practices mentioned above and addressing the opportunities for improvement, businesses can enhance their compliance efforts and reduce the risk of non-compliance.
Frequently Asked Questions (FAQs)
1. What is the purpose of a Compliance KPI Dashboard?
A Compliance KPI Dashboard helps organizations track their adherence to internal policies, regulations, and industry standards by monitoring key compliance metrics in real time.
2. How do I input data into the Compliance KPI Dashboard?
Data can be input manually into the “Actual Numbers” and “Target” sheets, while other sheets like the “Previous Year” sheet allow you to compare past performance.
3. Can I modify the KPIs in the Google Sheets dashboard?
Yes, the KPIs and formulas can be customized to meet your organization’s specific needs.
4. Is the Compliance KPI Dashboard in Google Sheets free?
Yes, Google Sheets is a free tool, making it an affordable option for organizations looking to track compliance.
5. How often should the data in the Compliance KPI Dashboard be updated?
Click to buy Compliance KPI Dashboard in Google Sheets
The data should be updated regularly, ideally monthly, to ensure that the dashboard reflects the most accurate compliance information.
Visit our YouTube channel to learn step-by-step video tutorials
Youtube.com/@NeotechNavigators
Watch the step-by-step video Demo: