Content creators are the backbone of digital marketing, social media, and online engagement. Tracking their performance across multiple metrics like engagement, reach, content output, and quality is crucial for ensuring productivity and growth.Content Creator KPI Dashboard in Google Sheets
Our Content Creator KPI Dashboard in Google Sheets is a ready-to-use solution designed to help marketing managers, social media teams, and content strategists monitor, analyze, and improve content performance efficiently.Content Creator KPI Dashboard in Google Sheets
What is a Content Creator KPI Dashboard?
A Content Creator KPI Dashboard is a data-driven tool that consolidates all key performance indicators (KPIs) related to content creation in one place. It allows organizations to:
-
Monitor Content Performance: Track content production, engagement, and reach.
-
Measure ROI: Evaluate the impact of content on audience growth and conversions.
-
Identify Trends: Analyze which types of content perform best over time.
-
Improve Strategy: Make data-driven decisions for better content planning and resource allocation.
Using Google Sheets for this purpose ensures the dashboard is cloud-based, accessible, and easily shareable with team members, making it perfect for collaborative work.
Key Features of the Dashboard
Click to Buy Content Creator KPI Dashboard in Google Sheets
The dashboard is structured into 6 main worksheet tabs, each serving a specific purpose:
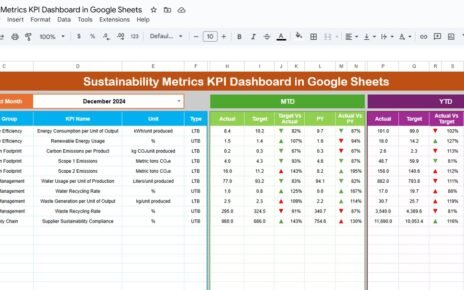
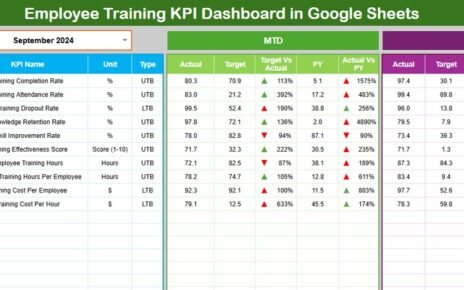
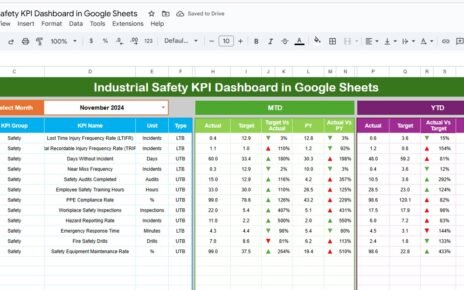
1. Dashboard Sheet Tab
This is the main sheet tab and provides a real-time overview of all KPIs.
Key Features:
-
Month Selection (D3): Select any month from the dropdown to update the dashboard automatically.
-
MTD (Month-to-Date) Metrics: Actual vs Target, Previous Year vs Actual with conditional formatting showing up/down arrows for quick insights.
-
YTD (Year-to-Date) Metrics: Same as MTD but accumulated over the year.
-
Visual Cues: Color-coded arrows and formatting to highlight positive or negative trends instantly.
This sheet provides a snapshot of all KPIs, helping managers identify top-performing content and areas needing improvement.

Click to Buy Content Creator KPI Dashboard in Google Sheets
2. KPI Trend Sheet Tab
The KPI Trend sheet allows deeper analysis of individual KPIs.
Features:
Select a KPI from the dropdown (C3) to view detailed information.
Display includes:
- KPI Group (e.g., Engagement, Output, Reach)
- Unit of KPI (e.g., number, %, views, likes)
- Type of KPI (Upper the Better/Lower the Better)
- Formula used to calculate the KPI
- KPI Definition for clarity and documentation
This tab is ideal for monitoring long-term trends and performance analysis.

3. Actual Number Sheet Tab
This sheet captures the actual performance numbers for each KPI.
Features:
-
Enter MTD and YTD numbers for a selected month.
-
Month can be changed in cell E1 to align with reporting periods.
-
These numbers feed into the Dashboard and KPI Trend sheets automatically.

Click to Buy Content Creator KPI Dashboard in Google Sheets
4. Target Sheet Tab
This tab contains the monthly targets for each KPI.
Features:
-
Input MTD and YTD targets for every KPI.
-
Targets serve as benchmarks for evaluating content creator performance in the Dashboard

5. Previous Year Number Sheet Tab
This sheet stores previous year’s KPI data for comparison.
Features:
-
Enter past-year numbers for each KPI.
-
Provides context and enables trend analysis (PY vs Actual) to identify growth or decline areas.

Click to Buy Content Creator KPI Dashboard in Google Sheets
6. KPI Definition Sheet Tab
This sheet is the master reference for all KPIs used in the dashboard.
Features:
Columns include:
- KPI Name
- KPI Group
- Unit
- Formula
- KPI Definition
- Type (Lower the Better / Upper the Better)
- Ensures clarity and consistency across all sheets.

Click to Buy Content Creator KPI Dashboard in Google Sheets
Example KPIs for Content Creators
Some common KPIs you can track using this dashboard:
-
Content Published: Number of posts, videos, or blogs created. (UTB)
-
Engagement Rate: Likes, comments, shares per post. (UTB)
-
Reach / Impressions: Total audience reached. (UTB)
-
Content Error Rate: Percentage of posts with errors. (LTB)
-
Average Time to Publish: Time from content idea to publication. (LTB)
-
Conversion Rate: Leads or actions generated per content piece. (UTB)
Benefits of Using this Dashboard
-
Centralized Performance Tracking: All KPIs in one interactive sheet.
-
Trend Analysis: Compare MTD, YTD, and Previous Year metrics effortlessly.
-
Data-Driven Decision Making: Identify high-performing content types and strategies.
-
Easy Collaboration: Cloud-based Google Sheets can be shared with team members.
-
Customizable: Add more KPIs, charts, or metrics as needed.
Opportunities for Improvement
Click to Buy Content Creator KPI Dashboard in Google Sheets
-
Automated Data Entry: Link social media analytics tools or Google Analytics to pull metrics automatically.
-
Conditional Alerts: Highlight KPIs below target in real-time.
-
Enhanced Visualization: Add charts for trending KPIs to the dashboard sheet.
-
Monthly Reporting: Generate printable summaries for management presentations.
Best Practices
-
Keep Data Updated: Regularly update actual numbers for accurate reporting.
-
Define KPI Formulas Clearly: Ensure everyone understands how each KPI is calculated.
-
Review Performance Monthly: Use the dashboard to track monthly trends.
-
Align KPIs with Goals: Ensure KPIs reflect organizational and marketing objectives.
-
Leverage Trend Analysis: Compare performance against previous months and years to track improvement.
Conclusion
Click to Buy Content Creator KPI Dashboard in Google Sheets
The Content Creator KPI Dashboard in Google Sheets is a complete solution for managing content creator performance:
-
Track engagement, output, and quality metrics
-
Compare performance with targets and previous periods
-
Generate actionable insights for strategy improvement
With this ready-to-use dashboard, content teams can monitor, analyze, and optimize content performance efficiently, saving time and improving results.
Visit our YouTube channel to learn step-by-step video tutorials
Youtube.com/@NeotechNavigators
Watch the step-by-step video Demo: