In the fast-paced digital world, tracking performance is key to winning the content marketing game. Whether you’re a small business, an agency, or an enterprise-level marketer, you need clear insights into what works and what doesn’t. This is where the Content Marketing KPI Dashboard in Google Sheets becomes your ultimate companion.
This article will walk you through everything you need to know about building, using, and benefiting from a powerful KPI dashboard specifically designed for content marketing efforts. From KPI structure to sheet functionality, advantages, improvement tips, and best practices—we’ve got it all covered.
What Is the Content Marketing KPI Dashboard in Google Sheets?
The Content Marketing KPI Dashboard in Google Sheets is a ready-to-use, dynamic, and customizable tool that helps you measure all key performance indicators (KPIs) related to your content marketing efforts.
Unlike expensive and complex software, this dashboard offers a simple, spreadsheet-based structure with powerful insights. It centralizes actual performance, targets, trends, and comparisons—all on one screen.
Sheet Structure Overview
This dashboard comes with 6 powerful worksheet tabs, each serving a specific purpose:
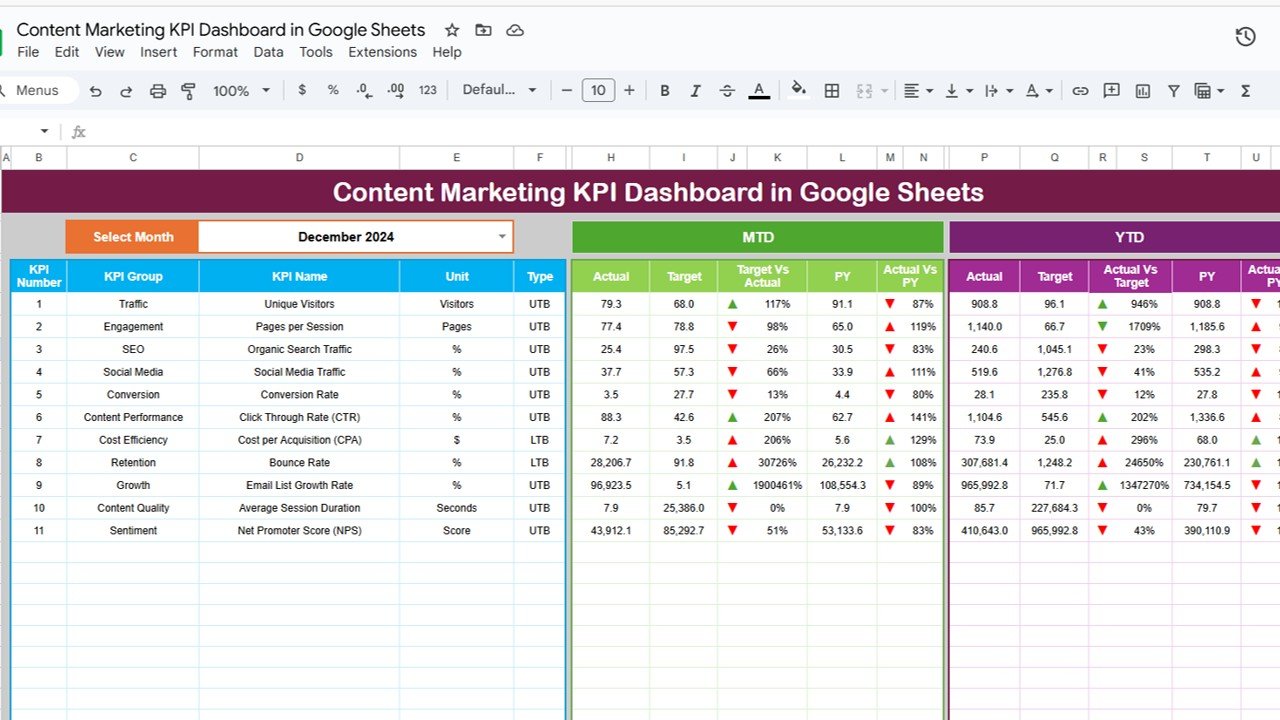
1. Dashboard Sheet Tab
This is the visual heart of the tool.
You can select a specific month from the dropdown in cell D3.
- MTD (Month-to-Date) and YTD (Year-to-Date) performance
- Actual vs. Target comparisons
- Current vs. Previous Year insights
All metrics use conditional formatting (green up arrows for good, red down arrows for underperformance).
Click to buy Content Marketing KPI Dashboard in Google Sheets
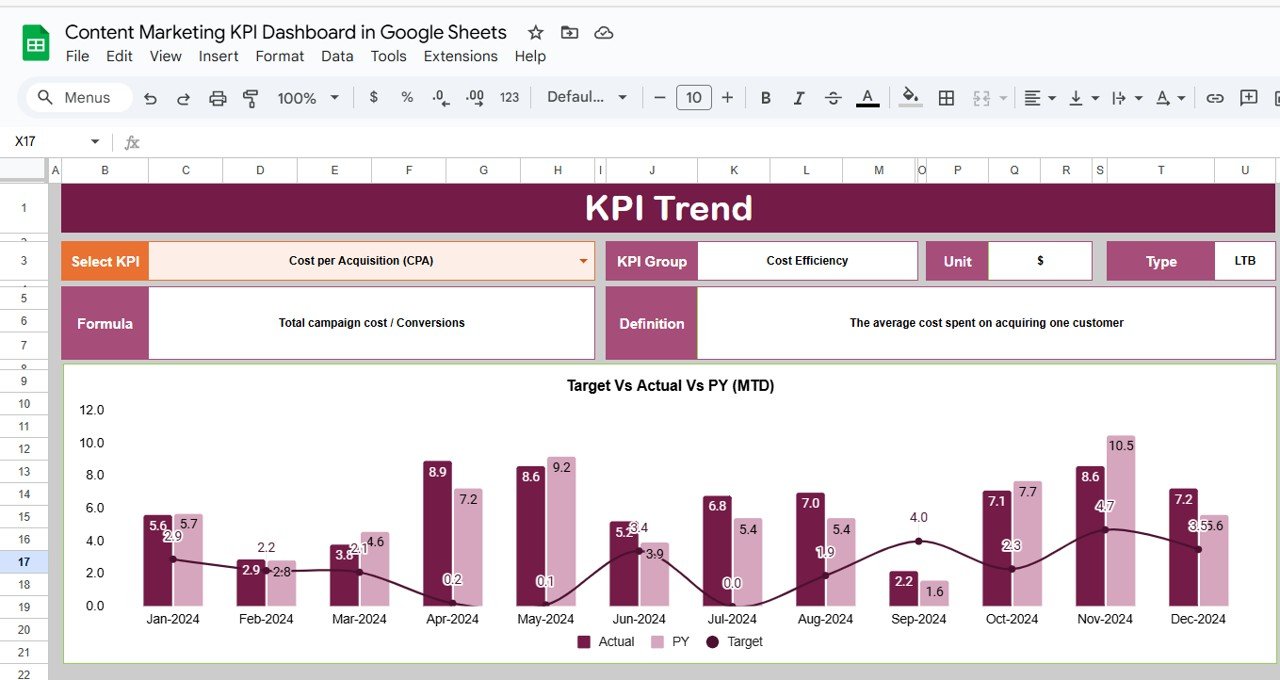
2. KPI Trend Sheet Tab
Here, you can:
Pick any KPI using the dropdown in cell C3
- KPI Group
- Unit
- Formula
- Type (UTB – Upper the Better, or LTB – Lower the Better)
- Monthly trend chart
This sheet gives you a deep dive into how a KPI has performed over time.
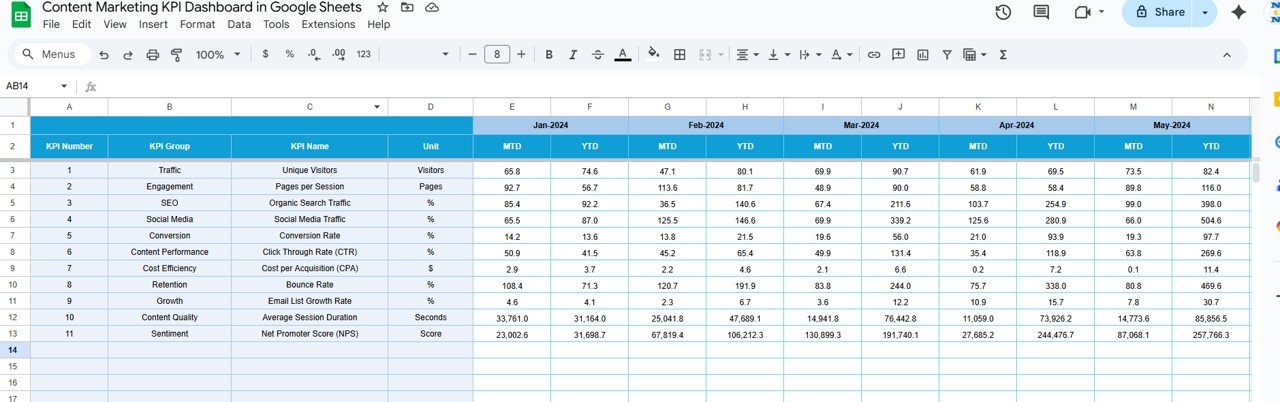
3. Actual Number Sheet Tab
This tab is for data entry.
-
Enter actual monthly values for all KPIs.
-
Change the starting month in cell
E1for correct chronological calculations.
Click to buy Content Marketing KPI Dashboard in Google Sheets
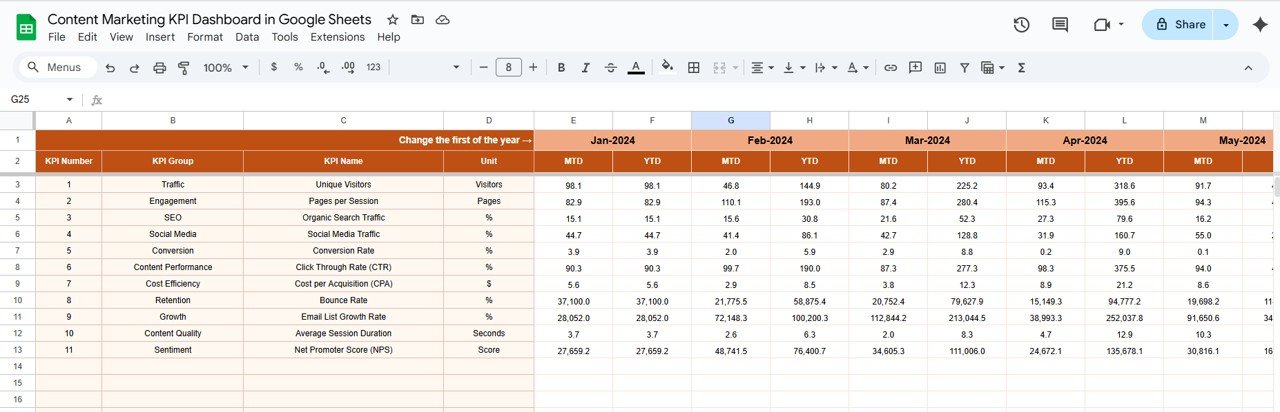
4. Target Sheet Tab
Here, you set performance benchmarks.
-
Enter MTD and YTD targets for each KPI.
-
Helps you track if you’re reaching your goals.
5. Previous Year Number Sheet Tab
Here, you can input last year’s data to compare historical performance.
-
Ensures meaningful year-over-year comparisons.
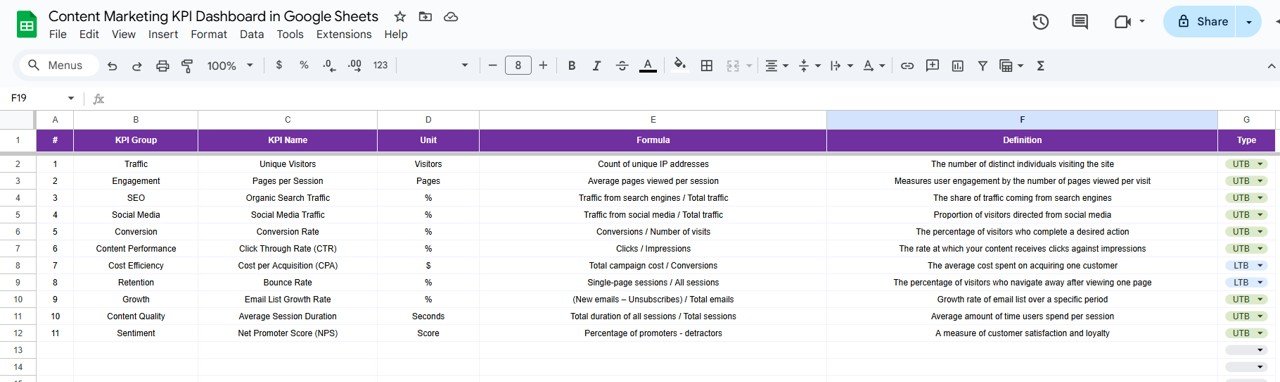
6. KPI Definition Sheet Tab
This is your KPI dictionary.
Define each KPI with:
- KPI Group
- Unit
- Formula
- Type (UTB/LTB)
- Short definition
Click to buy Content Marketing KPI Dashboard in Google Sheets
Advantages of Using the Content Marketing KPI Dashboard
Here’s why using this dashboard can significantly boost your content strategy:
-
All-in-One View: Get MTD, YTD, and year-over-year comparisons in one place.
-
Real-Time Updates: Change a single cell and the entire dashboard updates instantly.
-
Cost-Effective: No need for costly analytics tools.
-
Customizable: Add or remove KPIs, charts, and colors to match your branding.
-
Performance Tracking: Instantly identify what’s working and what needs attention.
-
Data-Driven Decisions: No more guesswork—plan with numbers.
-
Team Collaboration: Google Sheets allows sharing and live collaboration.
Opportunities for Improvement in Content Marketing KPI Dashboards
Click to buy Content Marketing KPI Dashboard in Google Sheets
While the dashboard is powerful, there’s always room to improve:
-
Add Visual Alerts: Use icons or heatmaps to show performance levels.
-
Integrate with Google Analytics: Use Google Sheets add-ons for automatic updates.
-
Include Campaign Tags: Segment KPIs by campaign or source.
-
Automate Weekly Reports: Use Google Apps Script for email summaries.
-
Add ROI Calculations: Link content costs to results.
-
Mobile Optimization: Make it readable on smartphones for on-the-go review.
Best Practices for Using the Content Marketing KPI Dashboard
To get the most out of your dashboard, follow these proven practices:
-
Update Data Weekly: Stay ahead with timely performance tracking.
-
Review Trends Monthly: Don’t just look at this month—see the bigger picture.
-
Use Conditional Formatting: Quickly spot underperforming KPIs.
-
Set SMART Targets: Make sure your targets are realistic and measurable.
-
Have a Review Meeting: Discuss KPI trends with your team regularly.
-
Back up Data: Keep copies of previous months’ data for audit and reference.
-
Limit Edit Access: Prevent accidental formula changes by restricting editing rights.
Conclusion
Click to buy Content Marketing KPI Dashboard in Google Sheets
In today’s competitive content landscape, data is your most powerful weapon. The Content Marketing KPI Dashboard in Google Sheets gives you the insights to improve performance, measure ROI, and stay ahead of your goals—all within a simple, sharable, and customizable interface.
Don’t wait until the end of the quarter to check your progress. With this dashboard, you can monitor performance every day and make smarter marketing decisions right away.
Frequently Asked Questions (FAQs)
Q1: Can I customize the KPIs in the dashboard?
You can add, remove, or rename KPIs easily from the KPI Definition sheet and data sheets.
Q2: Is it suitable for non-technical users?
The dashboard uses dropdowns and formulas that are easy to follow. No advanced Excel or coding knowledge is needed.
Q3: How can I automate data input from Google Analytics?
Use the Google Analytics add-on for Google Sheets to fetch data directly from your account into the Actual Number sheet.
Q4: Can this dashboard track campaign-specific content?
Just add a “Campaign” column to the data sheets and filter performance by campaign in pivot tables or slicers.
Q5: Is this dashboard mobile-friendly?
While Google Sheets works on mobile, formatting for mobile viewing may require simplification. You can duplicate the dashboard with mobile-friendly fonts and layout.
Visit our YouTube channel to learn step-by-step video tutorials
Youtube.com/@NeotechNavigators
Watch the step-by-step video Demo:
Click to buy Content Marketing KPI Dashboard in Google Sheets