Efficient courier operations depend on monitoring key performance metrics to ensure timely deliveries, customer satisfaction, and operational efficiency. The Courier Service KPI Dashboard in Google Sheets is a ready-to-use solution that allows you to track, analyze, and optimize your courier services in real-time.Courier Service KPI Dashboard in Google Sheets
This dashboard is ideal for courier companies, logistics teams, and delivery managers who want to gain insights into operational efficiency and service quality.Courier Service KPI Dashboard in Google Sheets
What is the Courier Service KPI Dashboard?
The Courier Service KPI Dashboard in Google Sheets is a structured and interactive reporting tool that consolidates all your KPIs in one place. It provides monthly and yearly trends, target comparisons, and visual insights to help managers make data-driven decisions.
By using this dashboard, courier services can:
-
Monitor delivery performance
-
Track operational efficiency
-
Identify areas for improvement
-
Compare performance with previous periods
Key Features of the Dashboard
The dashboard contains six worksheets, each designed for a specific purpose:
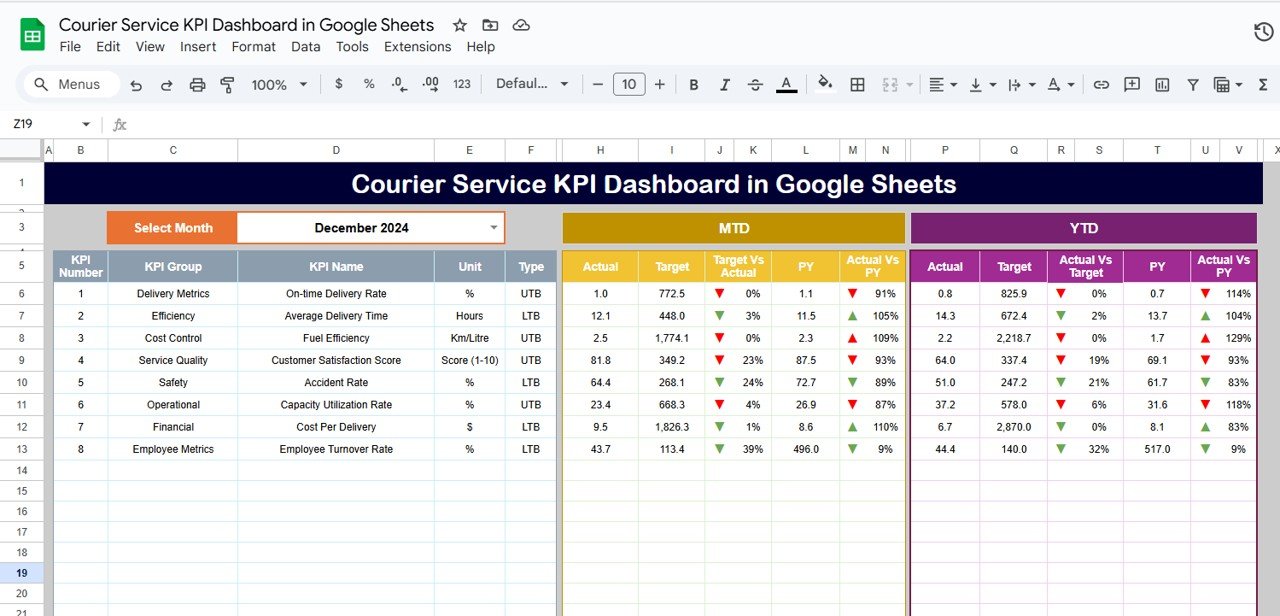
1. Dashboard Sheet Tab
The Dashboard sheet is the main interface where all KPIs are displayed.
Features Include:
-
Month Selection: Choose the month from the drop-down in range D3 to dynamically update all metrics
-
MTD Metrics: View Month-to-Date Actual, Target, and Previous Year values
-
YTD Metrics: View Year-to-Date Actual, Target, and Previous Year values
-
Comparisons: Target vs Actual and PY vs Actual comparisons with up/down arrow conditional formatting for quick insights
This sheet gives a snapshot of all KPIs, enabling quick decision-making.
Click to Buy Courier Service KPI Dashboard in Google Sheets
2. KPI Trend Sheet Tab
The KPI Trend sheet allows users to analyze individual KPI performance.
Features Include:
-
Select a KPI from the drop-down in range C3
-
View KPI Group, Unit, Type (Lower the Better / Upper the Better)
-
Display KPI Formula and Definition
This sheet is ideal for trend analysis and understanding the performance drivers.

3. Actual Numbers Sheet Tab
The Actual Numbers sheet is where you input real operational data.
Features Include:
-
Enter Actual numbers for MTD and YTD for each KPI
-
Change the month from range E1 (first month of the year)
-
Data automatically flows into the dashboard for visualization
This sheet ensures accurate reporting of courier operations.

Click to Buy Courier Service KPI Dashboard in Google Sheets
4. Target Sheet Tab
The Target sheet is where you define performance goals.
Features Include:
-
Enter monthly targets for each KPI (MTD and YTD)
-
Track actual performance against targets
-
Facilitate performance benchmarking and goal tracking

5. Previous Year Numbers Sheet Tab
This sheet stores last year’s KPI data for comparison.
Features Include:
-
Enter previous year’s monthly numbers
-
Dashboard automatically calculates PY vs Actual comparisons
-
Evaluate performance improvement year-over-year

Click to Buy Courier Service KPI Dashboard in Google Sheets
6. KPI Definition Sheet Tab
The KPI Definition sheet is a reference guide for all KPIs.
Features Include:
-
Define KPI Name, KPI Group, Unit, Formula, and KPI Definition
-
Specify whether each KPI is “Lower the Better” or “Upper the Better”
-
Ensure consistent understanding across the team

Advantages of Using This Dashboard
-
Real-Time KPI Tracking: Instantly view MTD and YTD performance
-
Data-Driven Insights: Make informed decisions using visualized KPIs
-
Performance Benchmarking: Compare targets against actuals and previous year metrics
-
User-Friendly: Interactive drop-downs and conditional formatting for easy interpretation
-
Customizable: Add new KPIs, months, or metrics as required
Best Practices
Click to Buy Courier Service KPI Dashboard in Google Sheets
-
Keep Data Updated: Enter actuals promptly to maintain dashboard accuracy
-
Regularly Monitor Trends: Use KPI Trend sheet to identify performance patterns
-
Review Targets Monthly: Update targets as business goals evolve
-
Use Conditional Formatting: Quickly spot areas performing above or below expectations
-
Share Dashboard with Team: Ensure all stakeholders have access for transparency
Conclusion
The Courier Service KPI Dashboard in Google Sheets is a comprehensive tool for logistics and courier teams. It provides clarity, tracks key metrics, and helps improve delivery performance while aligning with business targets. With this dashboard, courier companies can enhance operational efficiency, improve customer satisfaction, and monitor KPIs in a structured manner.
Visit our YouTube channel to learn step-by-step video tutorials