Crowdfunding is a powerful tool for raising funds for various projects, but managing the performance of a crowdfunding campaign requires careful tracking of key performance indicators (KPIs). The Crowdfunding KPI Dashboard in Google Sheets is a ready-to-use tool that helps campaign managers monitor and optimize their fundraising efforts in real-time. This template provides a comprehensive overview of your campaign’s progress, enabling you to make informed decisions and improve your strategy.
In this article, we will explain the Crowdfunding KPI Dashboard in Google Sheets, its key features, and how it can help you track essential metrics such as donations, backer engagement, and campaign progress.
What is the Crowdfunding KPI Dashboard in Google Sheets?
The Crowdfunding KPI Dashboard in Google Sheets is an interactive tool designed to help crowdfunding campaign managers track and analyze key metrics. From donations and backer engagement to campaign performance over time, this dashboard provides a clear view of all important KPIs. Whether you are managing a new crowdfunding initiative or tracking an ongoing campaign, this dashboard is an essential tool to ensure the success of your fundraising efforts.
The dashboard is organized into six main worksheets, each focused on different aspects of the crowdfunding campaign. The data in these sheets feeds into the dashboard, offering a high-level view of your campaign’s performance.
Key Features of the Crowdfunding KPI Dashboard in Google Sheets
The dashboard contains six worksheets, each designed to focus on specific aspects of your crowdfunding campaign:
1. Dashboard Sheet Tab
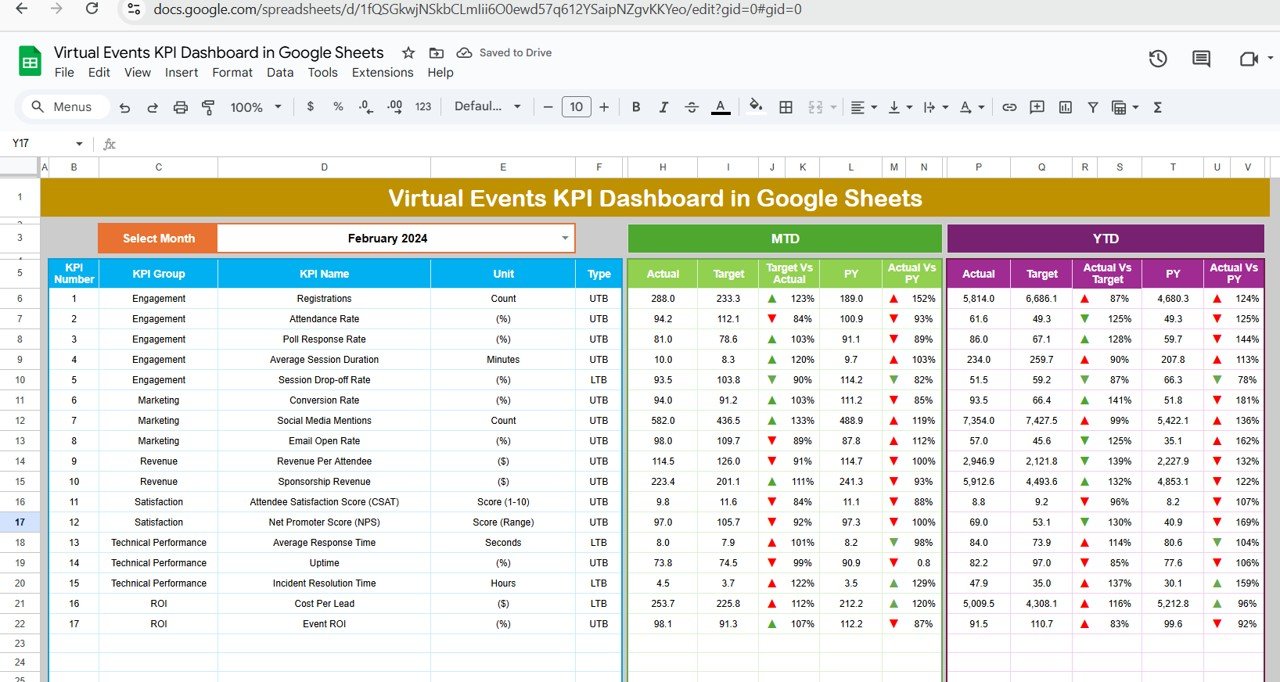
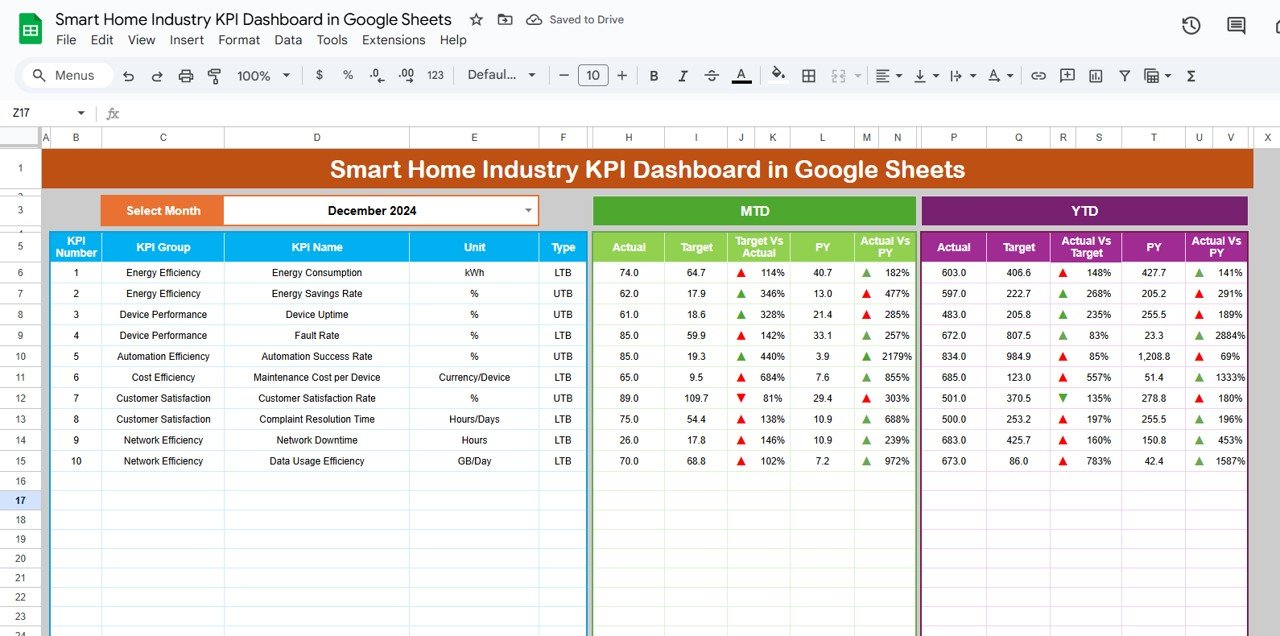
The Dashboard Sheet is the main page of the template, offering a comprehensive overview of all tracked KPIs. Key features include:
MTD (Month-to-Date) and YTD (Year-to-Date) Metrics:
- MTD Actual: Displays the actual data for the current month.
- MTD Target: Shows the target data for the current month.
- PY vs Actual: A comparison of the current month’s performance with the same period from the previous year (PY).
- YTD Actual: Shows the cumulative actual data for the year.
- Target vs Actual (YTD): Compares the YTD target with actual performance for the year.
- Conditional Formatting: Visual indicators, such as up/down arrows, show whether the performance is above or below the target and PY data.

Click to buy Crowdfunding KPI Dashboard in Google Sheets
2. KPI Trend Sheet Tab
The KPI Trend Sheet helps track individual KPIs over time, offering insights into long-term trends and performance patterns:
KPI Selection Dropdown:
You can select a KPI from the dropdown in C3, and the sheet will display:
- KPI Group: The category of the KPI (e.g., donation amount, backer engagement).
- Unit of KPI: The unit of measurement for the KPI (e.g., dollars, number of backers).
- Type of KPI: Whether the KPI is “Lower the Better” or “Upper the Better.”
- Formula of KPI: A formula explaining how each KPI is calculated.
- KPI Definition: An explanation of what each KPI measures and its relevance to the campaign.

Click to buy Crowdfunding KPI Dashboard in Google Sheets
3. Actual Number Sheet Tab
The Actual Number Sheet is where you enter the actual data for MTD and YTD. This sheet feeds into the dashboard and updates it automatically.
-
Monthly Data Entry:
Input the actual numbers for each KPI based on the selected month (indicated in E1), and the dashboard will automatically update to reflect the new data.

4. Target Sheet Tab
The Target Sheet allows you to input your target data for each KPI, both for MTD and YTD. These targets are used to measure the performance of your campaign.
-
Target Data Entry:
You will enter your target values for each KPI for both MTD and YTD. These targets are compared to actual performance on the dashboard.

Click to buy Crowdfunding KPI Dashboard in Google Sheets
5. Previous Year Number Sheet Tab
The Previous Year Number Sheet stores the data from the previous year, allowing you to track year-over-year performance and assess campaign growth.
-
Previous Year Data Entry:
Enter last year’s data for each KPI to compare current performance with previous years and evaluate your campaign’s progress over time.

6. KPI Definition Sheet Tab
The KPI Definition Sheet provides detailed definitions for each KPI, ensuring that everyone involved in the campaign understands what each metric tracks.
-
KPI Definitions:
This sheet contains the name, group, unit, formula, and definition for each KPI, providing clarity on the metrics being tracked
-

KPI Definition Sheet Tab
Advantages of Using the Crowdfunding KPI Dashboard
-
Comprehensive Tracking: Track all the key metrics of your crowdfunding campaign in one place, making it easy to monitor progress and identify issues.
-
Real-Time Insights: The dashboard updates automatically as you enter new data, providing real-time insights into campaign performance.
-
Visual Data Representation: With charts, graphs, and conditional formatting, the dashboard offers clear visual feedback, making it easy to identify areas where you’re excelling or need to improve.
-
Customizable for Your Campaign Needs: The template is fully customizable, so you can modify it to fit the unique needs of your crowdfunding campaign, whether you’re raising funds for a product, a nonprofit cause, or a creative project.
-
Data-Driven Decision Making: By tracking important KPIs such as donations, backer engagement, and referral rates, the dashboard helps you make data-driven decisions that improve your campaign strategy and increase the likelihood of reaching your fundraising goal.
Best Practices for Using the Crowdfunding KPI Dashboard
Click to buy Crowdfunding KPI Dashboard in Google Sheets
-
Update Data Regularly: Enter data regularly to ensure that the dashboard reflects the latest performance metrics. This helps you stay informed about the campaign’s progress.
-
Set Realistic Targets: Use historical data, market research, and insights from previous campaigns to set achievable fundraising targets. This will help you measure success and make adjustments when necessary.
-
Focus on High-Impact KPIs: Prioritize monitoring KPIs like Total Donations, Campaign Progress, and Referral Rate, as they directly impact the success of your crowdfunding campaign.
-
Leverage Trends for Strategy Adjustment: Use the KPI Trend Sheet to identify trends in donations and backer engagement over time, and adjust your strategy accordingly to boost results.
Frequently Asked Questions (FAQs)
Click to buy Crowdfunding KPI Dashboard in Google Sheets
1. How do I update the Crowdfunding KPI Dashboard?
Simply enter the actual data for each KPI in the Actual Number Sheet, and the dashboard will automatically update with the latest performance data.
2. Can I customize the dashboard for different types of campaigns?
Yes, the dashboard is fully customizable. You can add or modify KPIs based on the specific needs of your campaign, whether you’re running a product launch, charity event, or community project.
3. How can I track campaign performance over time?
Use the KPI Trend Sheet to monitor performance over multiple months or years. This allows you to see long-term trends in backer engagement and fundraising success.
Conclusion
The Crowdfunding KPI Dashboard in Google Sheets is an invaluable tool for monitoring and optimizing your crowdfunding campaigns. With real-time updates, customizable features, and clear visual insights, this dashboard helps you track donations, backer engagement, and campaign progress in one place. Whether you’re running your first campaign or have experience with multiple initiatives, this tool will help you make informed, data-driven decisions that increase your chances of success.
Visit our YouTube channel to learn step-by-step video tutorials
Youtube.com/@NeotechNavigators
Watch the step-by-step video Demo: