In today’s fast-paced business environment, tracking customer engagement is crucial for any organization aiming to improve its customer relationships and drive growth. One of the most effective ways to monitor customer engagement is through a Customer Engagement KPI Dashboard. This powerful tool allows businesses to visualize key performance indicators (KPIs) in an easily digestible format, helping them to make data-driven decisions.
In this article, we will dive deep into the Customer Engagement KPI Dashboard in Google Sheets. We will explore its key features, explain the importance of each KPI, and provide a structured guide on how to set it up. Whether you’re a marketer, business owner, or data analyst, this dashboard can help you track customer behavior, enhance engagement, and improve your overall customer experience strategy.
Introduction to Customer Engagement KPIs
Customer engagement KPIs are metrics used to assess how effectively a business is interacting with its customers. These KPIs help track the frequency, duration, and quality of customer interactions, which ultimately reflect the overall customer experience.
By using a Customer Engagement KPI Dashboard in Google Sheets, businesses can continuously monitor customer behavior and optimize strategies based on real-time data. The dashboard consolidates essential metrics and visualizes them in an easy-to-understand format, enabling stakeholders to make informed decisions.
Key Features of the Customer Engagement KPI Dashboard
The Customer Engagement KPI Dashboard in Google Sheets is designed with user-friendliness and flexibility in mind. Below are the six key worksheets in the dashboard:
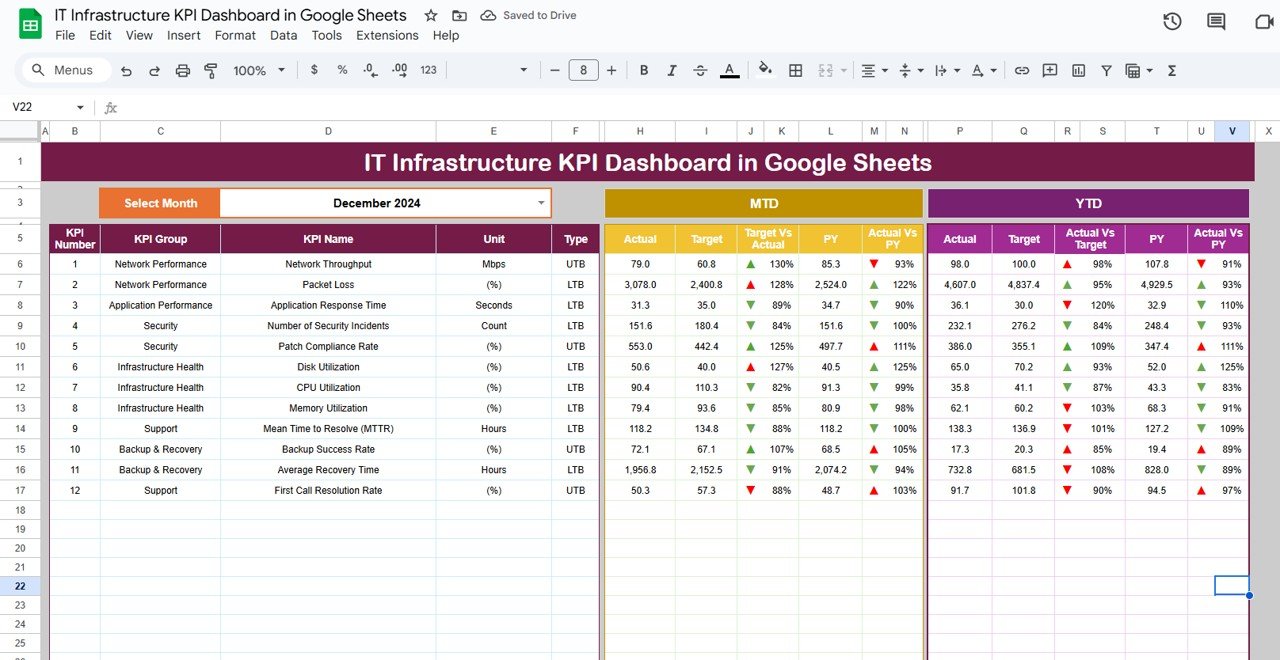
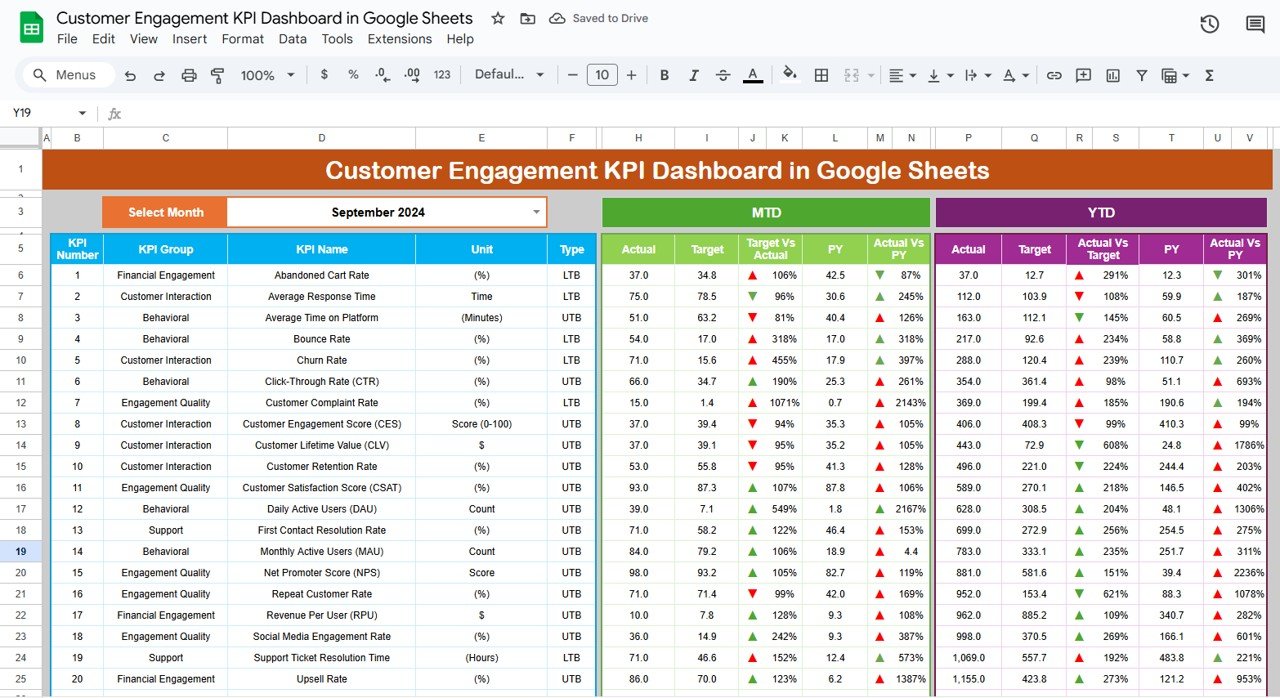
1. Dashboard Sheet Tab
This is the main sheet where all the information about your KPIs is displayed. It gives you a bird’s-eye view of the overall customer engagement performance for the selected month.
Key Features:
- Month Selector: A dropdown (Range D3) allows you to select the month, and the entire dashboard will update automatically to show data for that month.
- MTD and YTD Data: Displays Month-to-Date (MTD) and Year-to-Date (YTD) actuals, targets, and previous year’s data.
- Comparisons: Includes Target vs Actual and Previous Year (PY) vs Actual comparisons, with conditional formatting to highlight performance using up/down arrows.
Click to buy Customer Engagement KPI Dashboard in Google Sheets
2. KPI Trend Sheet Tab
This sheet allows you to track the performance trend of each KPI over time. Here, you can view detailed information about each KPI:
Key Features:
- KPI Selection: Select a KPI from the dropdown (Range C3) to see its associated data.
- KPI Details: The sheet displays the KPI’s Group, Unit, Type (whether it’s a “Lower the Better” or “Upper the Better” KPI), Formula, and Definition.

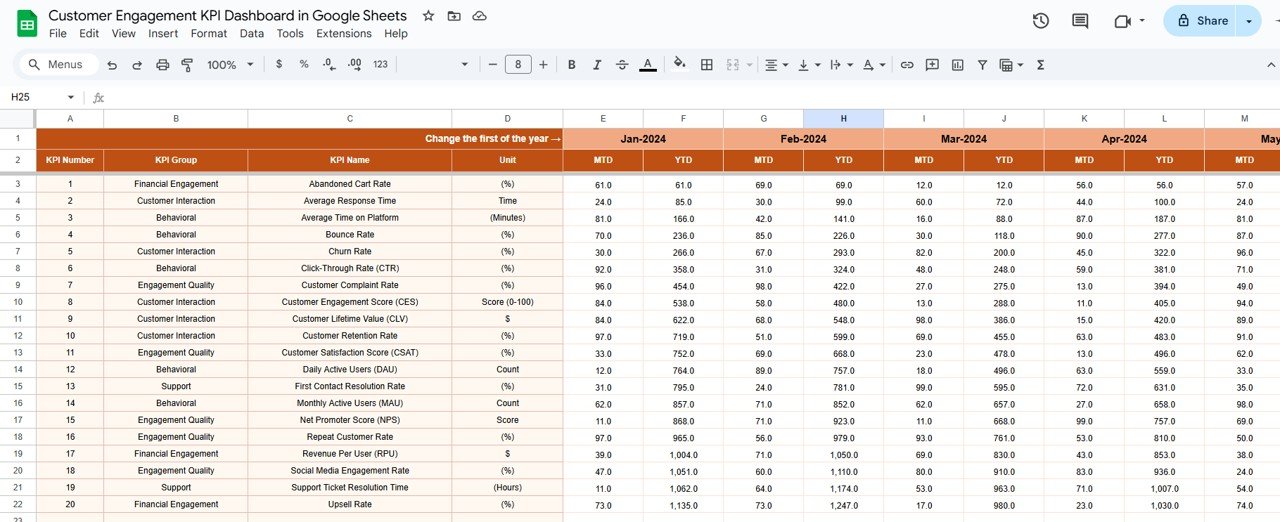
3. Actual Numbers Sheet Tab
In this sheet, you enter the actual numbers for each KPI for both YTD and MTD. The dashboard will pull this data to generate comparisons and trends.
Key Features:
- Month Selector: You can change the month from Range E1 to input data for that month.
- Data Entry: Input the actual customer engagement data (such as number of interactions, customer satisfaction scores, etc.) for each KPI.
Click to buy Customer Engagement KPI Dashboard in Google Sheets
4. Target Sheet Tab
This sheet allows you to set target values for each KPI for a particular month and year.
Key Features:
- MTD and YTD Targets: Enter target values for both Month-to-Date (MTD) and Year-to-Date (YTD) for each KPI.
- Comparison with Actuals: The dashboard will compare the actual performance with the target to highlight underperforming or overperforming metrics.

5. Previous Year Numbers Sheet Tab
This sheet stores the data for the previous year’s performance, which will be used for the PY vs Actual comparison.
Key Features:
- Data Input: Enter the previous year’s data for each KPI.
- Annual Comparison: The dashboard will compare the current year’s performance against the previous year’s performance.

Click to buy Customer Engagement KPI Dashboard in Google Sheets
6. KPI Definition Sheet Tab
In this sheet, you enter the name, group, unit, formula, and definition for each KPI. This ensures clarity and consistency in understanding each KPI’s purpose and calculation.

Advantages of Using a Customer Engagement KPI Dashboard
Implementing a Customer Engagement KPI Dashboard in Google Sheets offers several benefits to businesses, enabling better decision-making and more targeted customer strategies:
- Centralized Data: All customer engagement metrics are consolidated in one place, making it easy to track and compare different KPIs over time.
- Real-Time Tracking: The dashboard automatically updates when you input new data, ensuring that you always have access to real-time performance metrics.
- Data Visualization: With features like conditional formatting, up/down arrows, and graphical trends, the dashboard provides a visual representation of key metrics, making it easier for stakeholders to interpret the data.
- Easy Customization; You can easily modify the KPIs and data ranges to match the specific needs of your business, making it highly adaptable.
- Improved Customer Insights: By tracking customer engagement in real time, businesses can identify which areas need improvement and which strategies are working.
Opportunities for Improvement in Customer Engagement KPIs
Click to buy Customer Engagement KPI Dashboard in Google Sheets
Despite the numerous advantages, there are still opportunities for improvement in the Customer Engagement KPI Dashboard:
- Integration with Other Platforms: Currently, the dashboard requires manual data entry, which can be time-consuming. Integrating the dashboard with CRM or other customer engagement platforms could automate data entry and reduce errors.
- Advanced Data Analysis; While the dashboard provides basic data visualization, incorporating more advanced analysis like predictive analytics or sentiment analysis could provide deeper insights into customer engagement trends.
- More Interactive Features; Adding features like drill-down capabilities or interactive graphs could enhance the user experience, allowing stakeholders to dive deeper into the data.
Best Practices for Creating and Using the Customer Engagement KPI Dashboard
To ensure your Customer Engagement KPI Dashboard is effective, here are some best practices to follow:
- Set Clear and Relevant KPIs: Choose KPIs that truly reflect customer engagement and align with your business goals. Focus on metrics that provide actionable insights.
- Regular Data Updates; Regularly update the dashboard with the latest data to ensure you’re making decisions based on current performance, not outdated figures.
- Use Conditional Formatting Wisely; Conditional formatting (like up/down arrows) should be used to draw attention to critical data points, but it should not overwhelm the user. Keep it simple.
- Share with Stakeholders: Ensure that all relevant stakeholders have access to the dashboard so that they can stay informed and make data-driven decisions.
Frequently Asked Questions (FAQs)
Click to buy Customer Engagement KPI Dashboard in Google Sheets
What are Customer Engagement KPIs?
Customer engagement KPIs are metrics used to measure how effectively a business is interacting with its customers. These KPIs track customer behavior, such as interaction frequency, satisfaction, and loyalty.
How can a KPI Dashboard help improve customer engagement?
A KPI dashboard centralizes all customer engagement data, providing real-time insights into performance. By tracking and analyzing this data, businesses can identify areas for improvement and make informed decisions to enhance customer engagement.
Can I customize the KPIs in the Google Sheets Dashboard?
Yes, the KPIs in the dashboard can be customized to match the specific goals and needs of your business. You can modify the existing KPIs or add new ones to track different aspects of customer engagement.
How do I update the dashboard for each month?
You can update the dashboard by selecting the month from the dropdown in Range D3. Additionally, input the actual data, targets, and previous year’s figures for the selected month.
What is the best way to visualize customer engagement data?
Using charts, conditional formatting, and KPI trends allows you to visualize customer engagement data in an intuitive way. Highlighting key metrics with up/down arrows or graphs makes it easier to track performance and identify areas of improvement.
Conclusion
The Customer Engagement KPI Dashboard in Google Sheets is a powerful tool that can help businesses track and optimize their customer engagement strategies. By centralizing key metrics, offering real-time data, and providing clear visualizations, the dashboard empowers businesses to make data-driven decisions that enhance customer experiences. With the best practices outlined in this article and regular updates, you can ensure that your dashboard remains a valuable asset to your organization.
Click to buy Customer Engagement KPI Dashboard in Google Sheets
Visit our YouTube channel to learn step-by-step video tutorials
Youtube.com/@NeotechNavigators
Watch the step-by-step video Demo:
Click to buy Customer Engagement KPI Dashboard in Google Sheets