Understanding customer feedback is one of the most important parts of improving products, services, and customer experience. When feedback becomes difficult to organize, track, and analyze manually, businesses often miss important insights. To solve this challenge, the Customer Feedback Analysis Dashboard in Google Sheets provides a ready-to-use, fully automated, and visually rich solution.Customer Feedback Analysis Dashboard in Google Sheets
This dashboard helps you track feedback volume, ratings, sentiment, response time, product analysis, and feedback type performance. It also includes an advanced search system and a clean data sheet for easy management.Customer Feedback Analysis Dashboard in Google Sheets
In this article, we explain every card, chart, and feature of the tool in a simple and clear way.Customer Feedback Analysis Dashboard in Google Sheets
What Is a Customer Feedback Analysis Dashboard in Google Sheets?
The Customer Feedback Analysis Dashboard in Google Sheets is a pre-designed, automated reporting tool that helps businesses:
-
Review total feedback received
-
Track average rating and response time
-
Analyze sentiment (positive, neutral, negative)
-
See product-wise performance
-
Identify negative feedback areas
-
Track monthly trends
-
Filter and search feedback instantly
This dashboard is perfect for customer support teams, product managers, quality teams, and businesses aiming to improve customer satisfaction.
Dashboard Cards – Key Metrics in One View
Click to Buy Customer Feedback Analysis Dashboard in Google Sheets
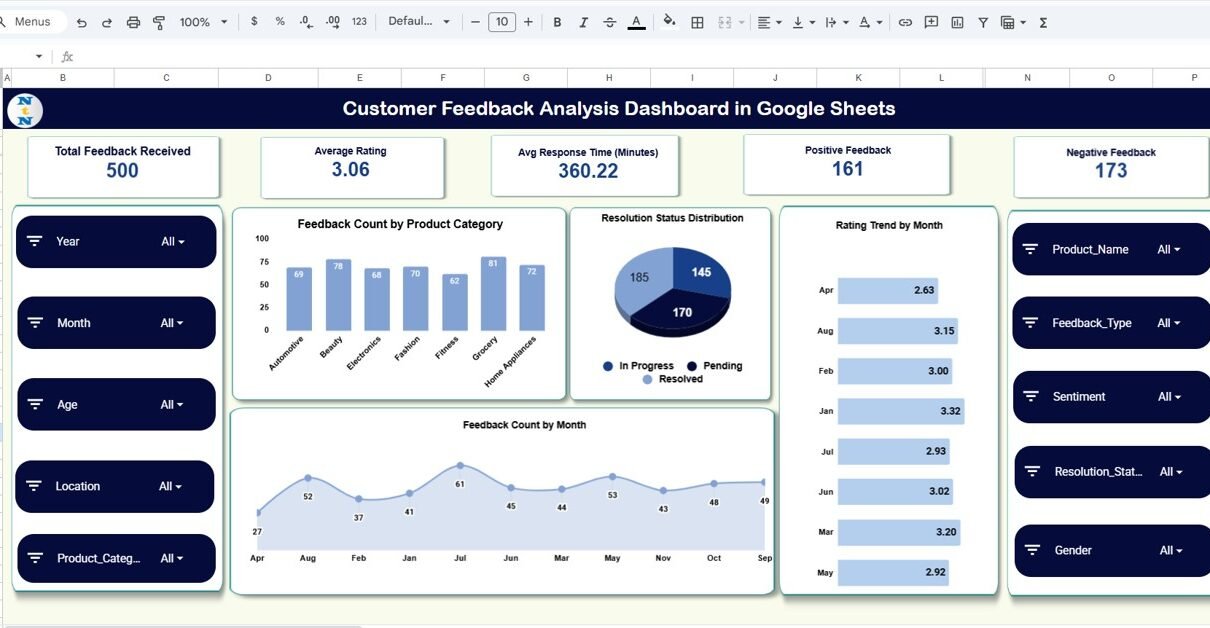
The dashboard displays five important KPIs at the top:
Total Feedback Received
Shows the total number of feedback entries collected.
Average Rating
Highlights the overall customer experience score.
Avg Response Time (Minutes)
Shows how efficiently the team responds to customer concerns.
Positive Feedback
Counts all feedback marked as “Positive”.
Negative Feedback
Displays all “Negative” or “Dissatisfied” reviews.
These cards give you instant insights into customer experience.
Feedback Count by Product Category
This chart helps you understand:
-
Which product categories receive the most feedback
-
Where the highest interactions come from
-
Which products need deeper attention
High feedback volume often indicates high usage or potential issues.
Resolution Status Distribution
This visual shows the percentage or count of:
-
Resolved
-
Pending
-
In-progress
-
Escalated
It helps monitor customer service performance and backlog.
Rating Trend by Month
Click to Buy Customer Feedback Analysis Dashboard in Google Sheets
This chart tracks how your average rating changes month-by-month.
You can easily identify:
This is one of the most important trend charts.
Feedback Count by Month
Displays total feedback volume every month.
Useful for:
-
Workload planning
-
Understanding market cycles
-
Comparing peak vs low periods

Click to Buy Customer Feedback Analysis Dashboard in Google Sheets
Sentiment Analysis Section
The dashboard includes a complete sentiment analysis breakdown.
Charts Included:
Sentiment by Product Category
Shows sentiment quality (Positive, Neutral, Negative) for each product category.
Feedback Count by Sentiment
Helps understand the emotional distribution of feedback.
Sentiment by Location
Shows geographic areas with more positive or negative feedback.
This helps identify regional issues or strong markets.

Click to Buy Customer Feedback Analysis Dashboard in Google Sheets
Feedback Type Analysis
This section explains performance based on feedback type such as:
Charts Included:
-
Average Rating by Feedback Type
-
Feedback Count by Feedback Type
-
Negative Feedback by Feedback Type
This helps you understand which feedback type needs the most attention.

Product Analysis Section
This part helps in deeper product-level evaluation.
Charts Included:
-
Average Rating by Product → identifies product quality level
-
Negative Feedback by Product → highlights problem areas
Product teams can use this to prioritize improvements.

Click to Buy Customer Feedback Analysis Dashboard in Google Sheets
Search Function – Quick and Accurate Filtering
The Search Sheet Tab lets you:
-
Search by keyword
-
Search by field name
-
Instantly filter feedback
-
Find specific customer comments
This is extremely useful for customer service and quality audits.

Click to Buy Customer Feedback Analysis Dashboard in Google Sheets
Data Sheet – Backend Storage
All feedback entries stay organized in the Data Sheet.
You can update:
-
Product name
-
Rating
-
Sentiment
-
Feedback type
-
Customer name
-
Response time
-
Resolution status
The dashboard updates automatically based on the data.

Click to Buy Customer Feedback Analysis Dashboard in Google Sheets
Advantages of Customer Feedback Analysis Dashboard in Google Sheets
-
No expensive software required
-
100% cloud-based and real-time
-
Beautiful visualization for insight-based decisions
-
Improves response time and customer satisfaction
-
Helps track negative reviews before they grow
-
Easy to use for non-technical users
-
Auto-updating charts and KPIs
Opportunities for Improvement
-
Add automated email alerts for negative feedback
-
Add customer profile view
-
Add product comparison dashboard
-
Add NPS (Net Promoter Score) module
-
Add AI-based sentiment classifier
Best Practices for Using This Dashboard
Click to Buy Customer Feedback Analysis Dashboard in Google Sheets
-
Update feedback data daily
-
Categorize feedback consistently
-
Use monthly insights to improve product performance
-
Track negative feedback trends regularly
-
Share dashboard with customer-facing teams
-
Use search tab for solving customer complaints faster
Conclusion
Click to Buy Customer Feedback Analysis Dashboard in Google Sheets
The Customer Feedback Analysis Dashboard in Google Sheets is a complete and powerful tool for understanding customer experience. With inspection-ready charts, sentiment analysis, product ratings, and detailed KPI cards, it provides everything you need to make data-driven improvements.
Whether you are managing a product, service center, or customer support team, this dashboard helps you stay ahead of customer expectations.
Frequently Asked Questions (FAQ)
1. Can I add more charts?
Yes, you can insert additional charts using Google Sheets’ built-in features.
2. Does the dashboard update automatically?
Yes, when you update the Data Sheet, the dashboard refreshes instantly.
3. Can I customize feedback types?
Yes, you can add, modify, or remove types as needed.
4. Is this suitable for small businesses?
Absolutely — the dashboard is ideal for SMEs and startups.
5. Is Google Sheets safe for storing feedback?
Yes, you can restrict access and protect sheets.
Watch the step-by-step video Demo:
Visit our YouTube channel to learn step-by-step video tutorials
Youtube.com/@NeotechNavigators
Click to Buy Customer Feedback Analysis Dashboard in Google Sheets