Customer retention is one of the key metrics to measure business success. A high retention rate indicates customer satisfaction and loyalty, which can drive long-term profitability. The Customer Retention KPI Dashboard in Google Sheets is a powerful tool designed to help businesses monitor and track their customer retention metrics effectively.
This dashboard allows businesses to analyze critical Key Performance Indicators (KPIs) related to customer retention, such as repeat purchase rate, customer lifetime value, and churn rate, all in one place. In this article, we will guide you through the key features of the Customer Retention KPI Dashboard, explain how to use it, and highlight the value it can bring to your business.
What is the Customer Retention KPI Dashboard in Google Sheets?
The Customer Retention KPI Dashboard is an advanced tool built on Google Sheets that allows businesses to track and analyze customer retention metrics. It provides real-time insights into customer behavior, including retention rates, churn rates, repeat purchases, and more. The dashboard helps businesses understand their customer retention efforts and take actionable steps to improve them.
Key Features of the Customer Retention KPI Dashboard in Google Sheets
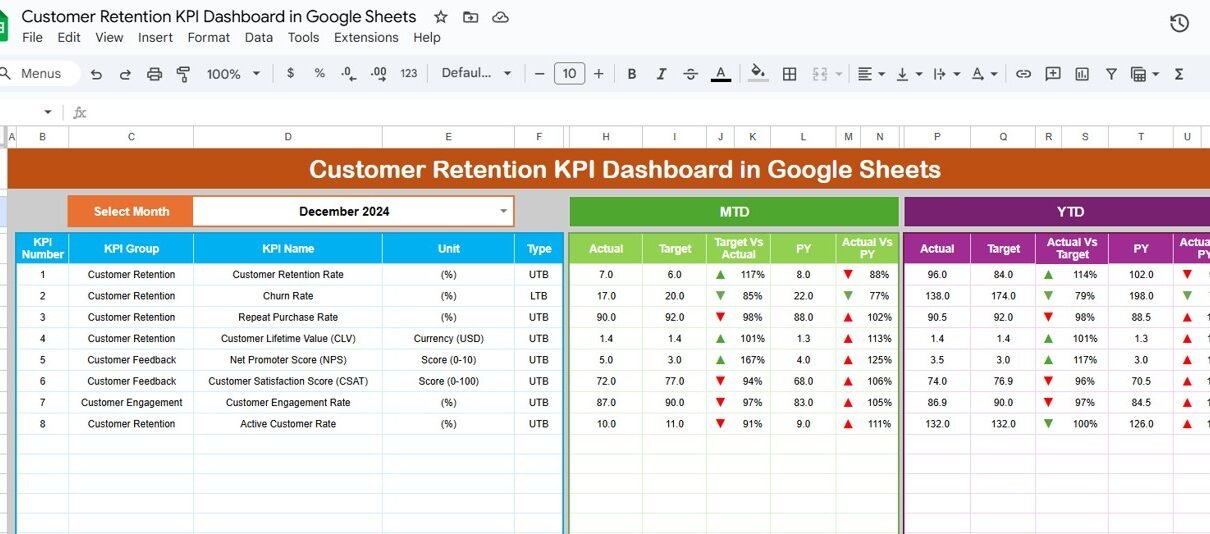
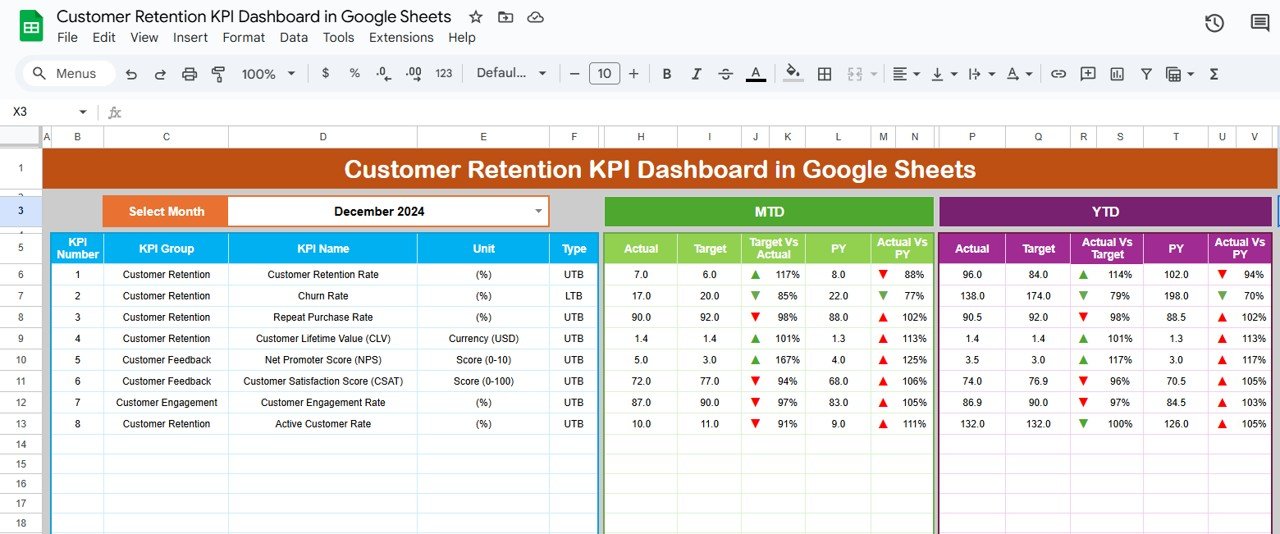
1) Dashboard Sheet Tab: Centralized Overview of KPIs
The Dashboard Sheet Tab provides a high-level view of all your customer retention KPIs. It includes:
Month Selection (Range D3): You can select the month from a dropdown menu, and the entire dashboard will update to reflect the data for that specific month.
KPIs Displayed:
- MTD (Month-to-Date) Actual: Shows the actual retention data for the current month.
- MTD Target: Displays the target value for the current month’s retention KPI.
- Previous Year (PY) MTD: Displays the data from the same period last year for comparison.
- Target vs. Actual (MTD): Shows a percentage comparison between the target and actual retention data for the month.
YTD (Year-to-Date) Data: Similar to MTD data, YTD shows the cumulative retention data for the year.
- YTD Actual: The actual retention data accumulated for the year.
- YTD Target: The retention target for the year.
- PY YTD: The retention data from the same period last year for comparison.
- Target vs. Actual (YTD): A comparison between the target and actual YTD retention.
-
Conditional Formatting: The dashboard uses up and down arrows with color coding (green for good performance, red for poor performance) to visually indicate the performance status of each KPI.
This tab acts as a summary page, giving you a quick snapshot of your current customer retention performance.
Click to buy Customer Retention KPI Dashboard in Google Sheets
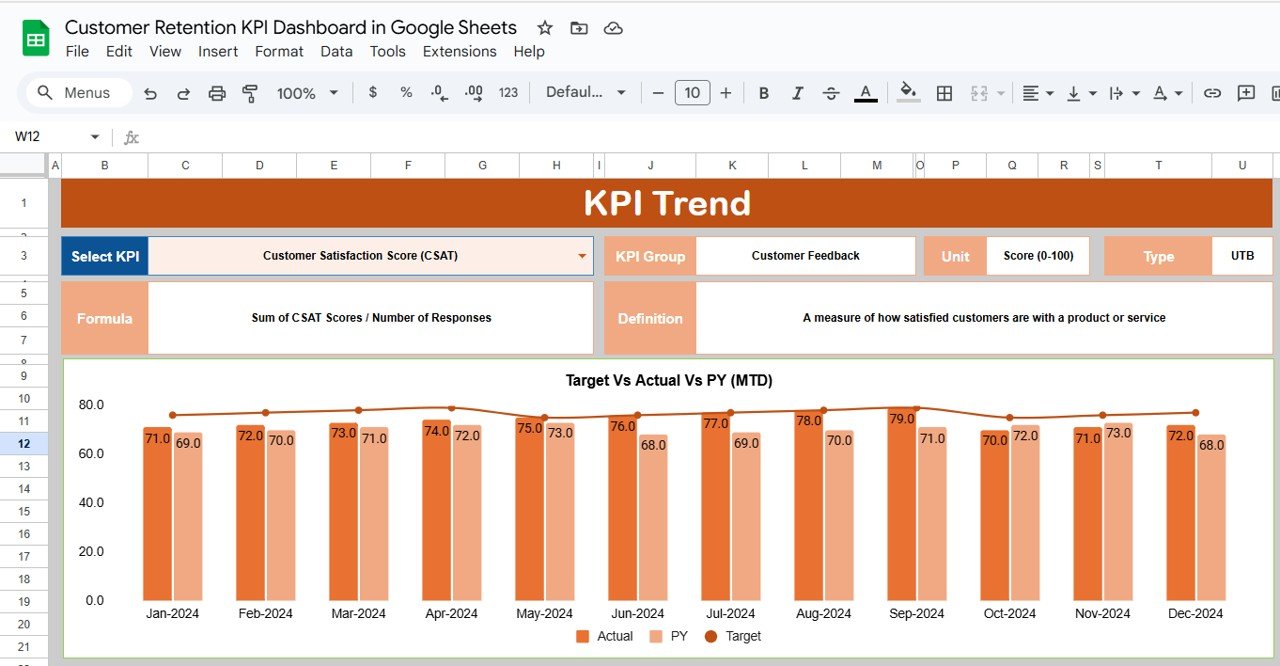
2) KPI Trend Sheet Tab: Track KPI Trends Over Time
The KPI Trend Sheet Tab allows you to monitor the trend of customer retention KPIs over a selected period. Here’s what you’ll find:
-
KPI Name Selection (Range C3): Select any KPI from the dropdown to view the trend data for that specific KPI.
-
KPI Group: Displays the category of the KPI (e.g., churn rate, repeat purchase rate).
-
Unit of KPI: The unit of measurement for the selected KPI (e.g., percentage, dollar amount).
-
Type of KPI: Indicates whether the KPI is “Lower the Better” (LTB) or “Upper the Better” (UTB).
-
Formula and Definition: The formula used to calculate the KPI and its definition are provided for clarity.
This tab helps you track how each KPI performs over time, allowing you to analyze trends and identify areas for improvement
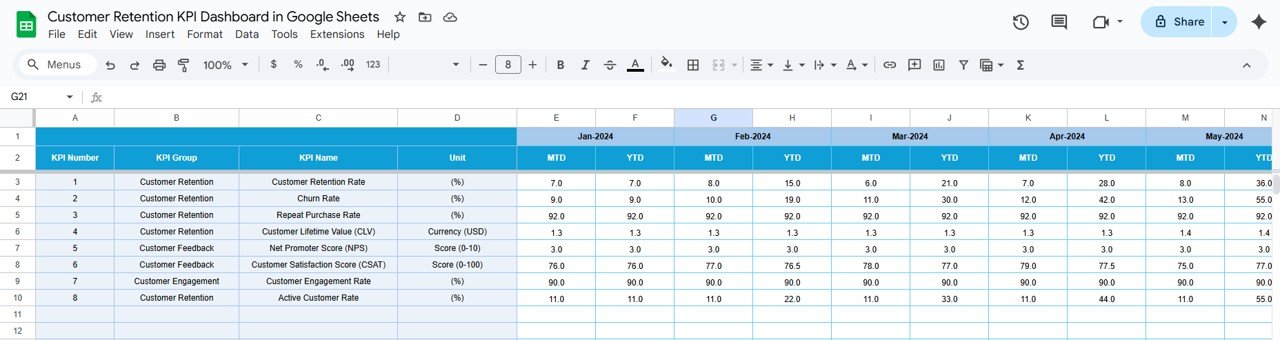
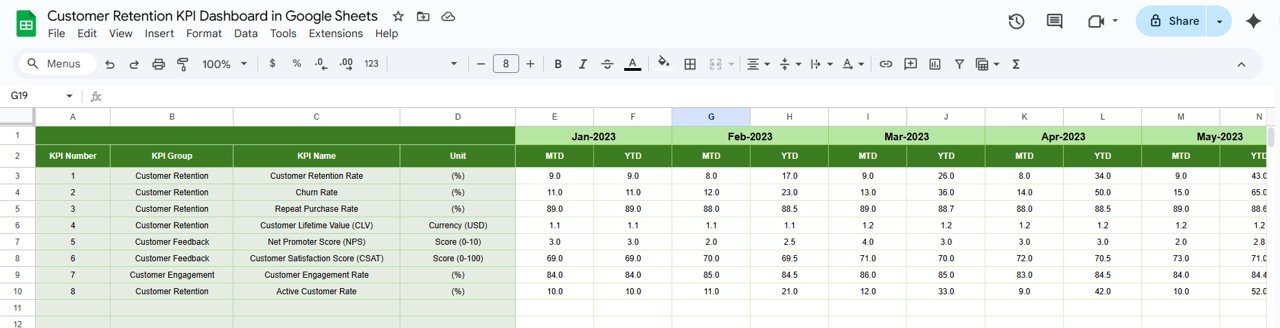
3) Actual Number Sheet Tab: Enter Actual Retention Data
In the Actual Number Sheet Tab, you can manually enter the actual customer retention data for the selected month and year. The key features include:
-
MTD Actual and YTD Actual Data: Input the actual retention numbers for both Month-to-Date and Year-to-Date.
-
Month Selection (Range E1): Select the month for which you are entering the data, ensuring that the numbers reflect the correct time period.
This sheet is essential for inputting the raw data that drives the calculations and insights in the rest of the dashboard.
Click to buy Customer Retention KPI Dashboard in Google Sheets
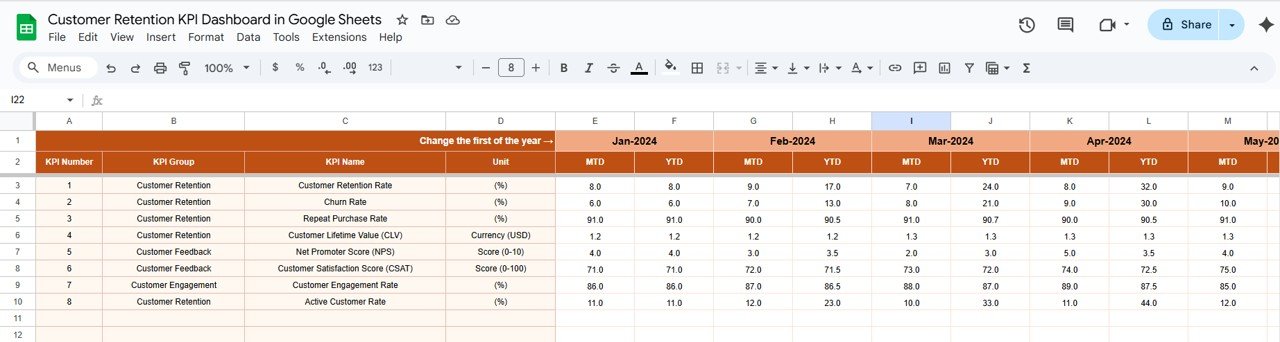
4) Target Sheet Tab: Set Customer Retention Targets
The Target Sheet Tab allows you to set your target values for each KPI. This sheet includes:
-
MTD Target: The retention target for the current month.
-
YTD Target: The retention target for the entire year.
-
Data Entry for Each KPI: Enter the target values for various customer retention KPIs.
Setting clear targets is crucial for comparing actual performance against the goals, helping you track progress and make necessary adjustments.
5) Previous Year Number Sheet Tab: Compare with Last Year
In the Previous Year Number Sheet Tab, you can input the customer retention data from the previous year. This data helps in comparing performance over time:
-
MTD PY Data: Input the data for the same month last year to compare with the current MTD data.
-
YTD PY Data: Input the data for the entire year from the previous year to compare with the current YTD data.
This sheet allows you to evaluate how well you are retaining customers compared to the previous year and identify any year-over-year changes.
Click to buy Customer Retention KPI Dashboard in Google Sheets
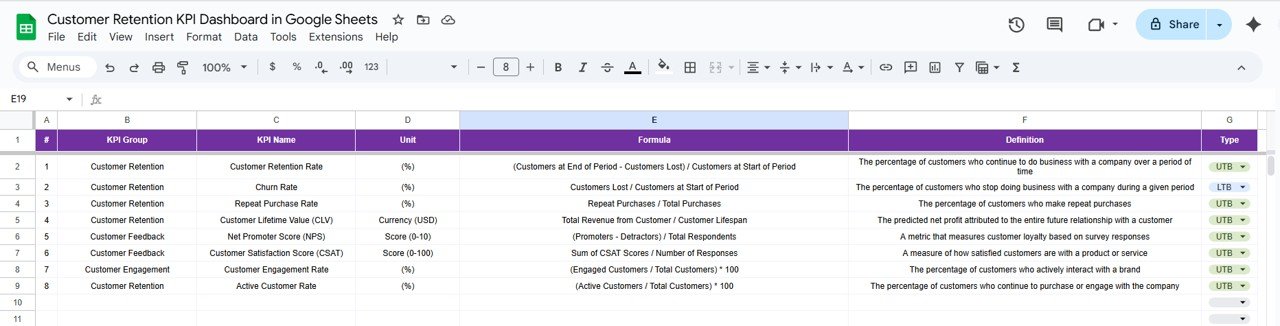
6) KPI Definition Sheet Tab: Clear Definitions and Formulas
The KPI Definition Sheet Tab provides a detailed overview of each KPI used in the dashboard. This sheet includes:
-
KPI Name: The name of each customer retention KPI.
-
KPI Group: The category to which the KPI belongs.
-
Unit: The unit of measurement for the KPI.
-
Formula: The formula used to calculate the KPI.
-
Definition: A brief explanation of what the KPI measures.
This sheet ensures that all team members are on the same page when interpreting the KPIs and ensures consistency in reporting.
Benefits of the Customer Retention KPI Dashboard
Click to buy Customer Retention KPI Dashboard in Google Sheets
The Customer Retention KPI Dashboard offers several advantages:
-
Real-Time Insights: Quickly assess the performance of customer retention efforts and take corrective actions where needed.
-
Data-Driven Decisions: Use accurate data to drive decisions about improving customer retention strategies.
-
Trend Analysis: Identify trends over time to determine what’s working and what needs improvement.
-
Goal Setting and Monitoring: Set targets for each KPI and track performance against them to improve retention efforts.
Conclusion
The Customer Retention KPI Dashboard in Google Sheets is a powerful and essential tool for businesses that want to improve customer loyalty and retention. With easy-to-use functionality and real-time insights, this dashboard will help businesses track key customer retention metrics and make data-driven decisions to improve retention strategies.
Frequently Asked Questions (FAQs)
Click to buy Customer Retention KPI Dashboard in Google Sheets
1. How do I set the targets for customer retention?
Targets for customer retention can be set in the Target Sheet Tab. Enter the target values for both MTD and YTD retention KPIs.
2. Can I track customer retention trends over time?
Yes, the KPI Trend Sheet Tab allows you to track trends for each customer retention KPI over a selected period.
3. What if my data doesn’t update automatically?
Ensure that the data in the Actual Number Sheet Tab is correctly entered, as this sheet feeds into the dashboard calculations.
4. How do I compare this year’s performance to last year’s?
You can compare current year performance with the previous year by using the Previous Year Number Sheet Tab, where you can input the past year’s data.
Visit our YouTube channel to learn step-by-step video tutorials
Youtube.com/@NeotechNavigators
Click to buy Customer Retention KPI Dashboard in Google Sheets