Cyber threats are becoming more frequent and complex, and organizations need to respond quickly and effectively to avoid severe consequences. However, without tracking key performance indicators (KPIs), it’s difficult to know whether your incident response efforts are working.
That’s why a Cyber Incident Response KPI Dashboard in Google Sheets is a game-changing solution. It allows you to monitor essential metrics, analyze performance trends, and make informed decisions—all within an easy-to-use, cloud-based platform.
In this guide, we’ll explore how this dashboard works, its structure, benefits, and how you can use it to manage cyber incident response more efficiently.
What Is a Cyber Incident Response KPI Dashboard?
A Cyber Incident Response KPI Dashboard is a centralized tool built in Google Sheets that tracks the performance of your cybersecurity incident response process. It gives your team a clear picture of how fast you detect, respond to, and resolve incidents.
Using this dashboard, you can compare actual results with targets, track month-to-date (MTD) and year-to-date (YTD) performance, monitor trends, and identify problem areas that need improvement.
Key Features of the Dashboard
This dashboard includes six worksheets, each designed for specific functions in the incident response workflow.
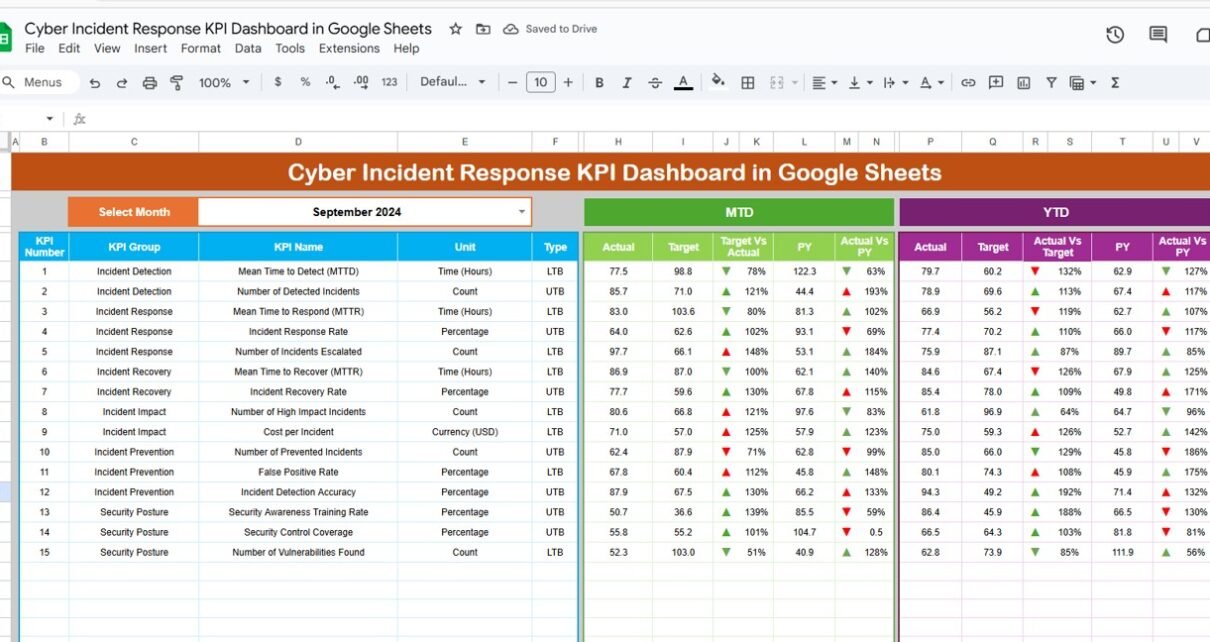
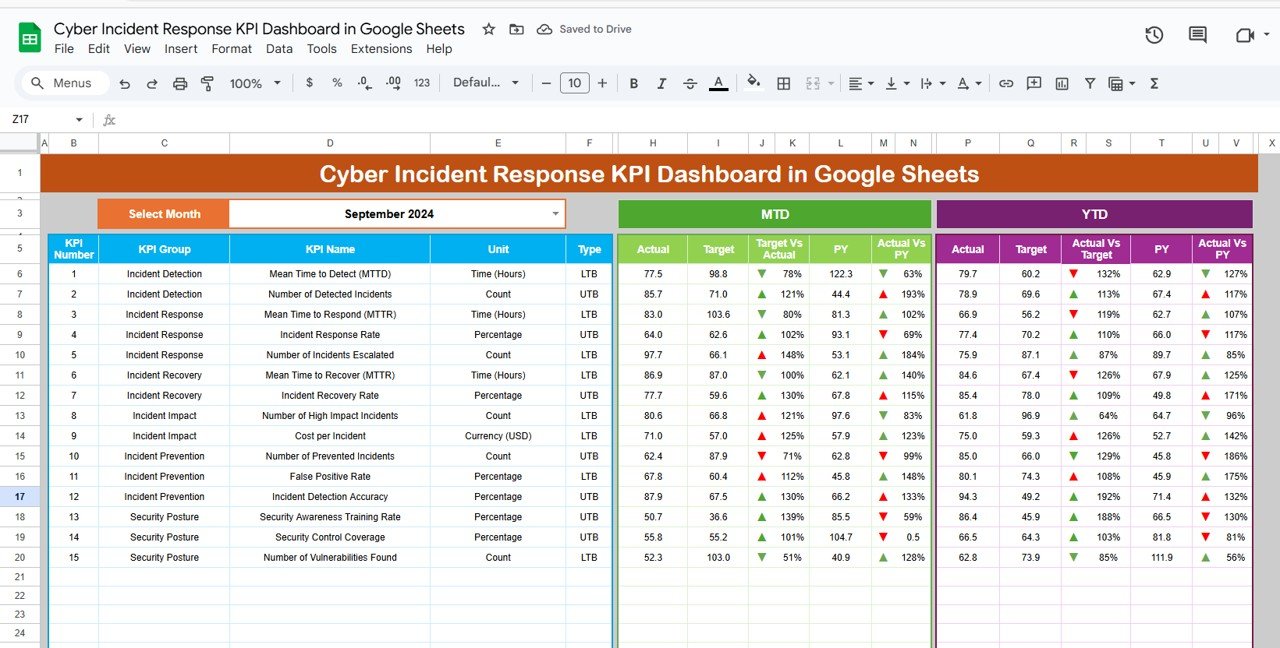
1. Dashboard Sheet Tab
This is the main visual page where users can select the month (cell D3) from a dropdown list. Once selected, the dashboard updates automatically to show current performance.
This sheet displays:
-
MTD Actual, Target, and Previous Year data
-
YTD Actual, Target, and Previous Year data
-
Target vs. Actual and Previous Year vs. Actual comparisons
-
Conditional formatting with up/down arrows to indicate trends
Click to buy Cyber Incident Response KPI Dashboard in Google Sheets
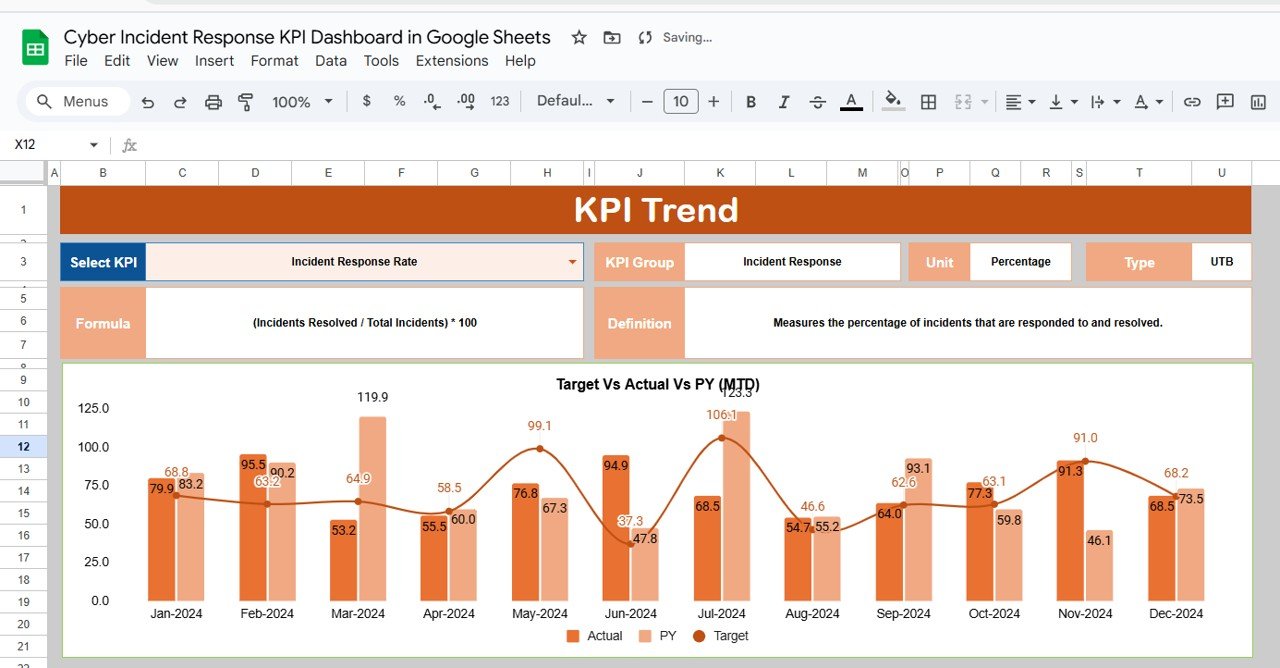
2. KPI Trend Sheet Tab
This sheet allows users to view trends for a selected KPI. After choosing a KPI from the dropdown (cell C3), the sheet displays:
-
KPI Group
-
Unit of measurement
-
Type (Lower the Better or Upper the Better)
-
Formula
-
Definition
This sheet is helpful for reviewing performance of critical KPIs over time.
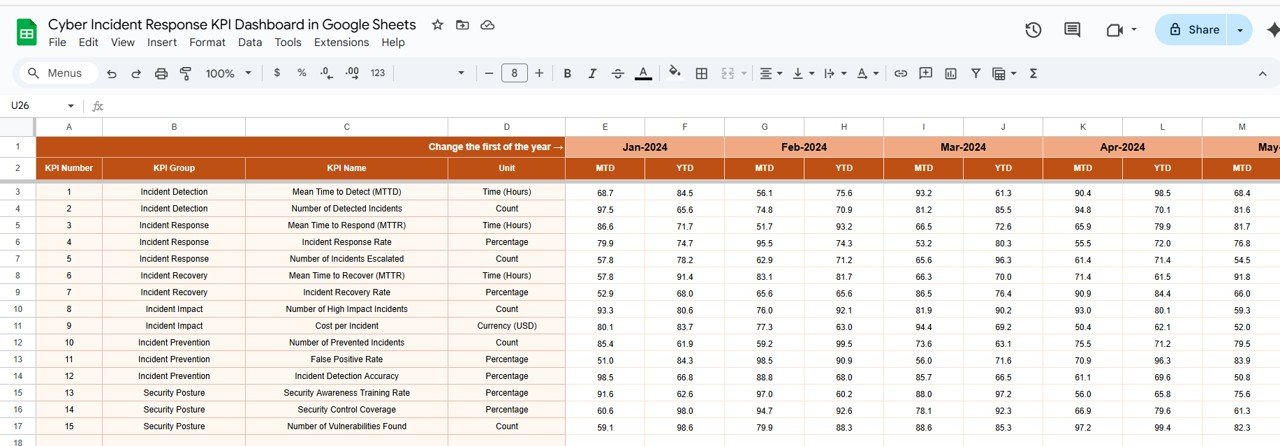
3. Actual Numbers Sheet Tab
In this tab, users enter the actual values for each KPI. It includes MTD and YTD numbers and allows month selection using cell E1. This is the main source of data used across the dashboard.
Click to buy Cyber Incident Response KPI Dashboard in Google Sheets
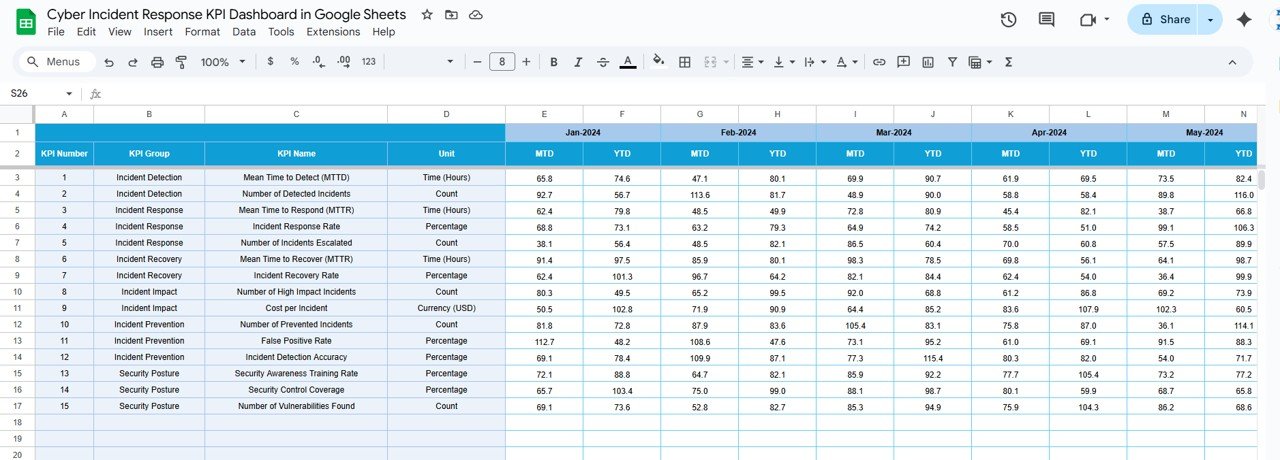
4. Target Sheet Tab
This tab allows users to input target values for each KPI, both for MTD and YTD. These targets help compare expected performance with actual results.
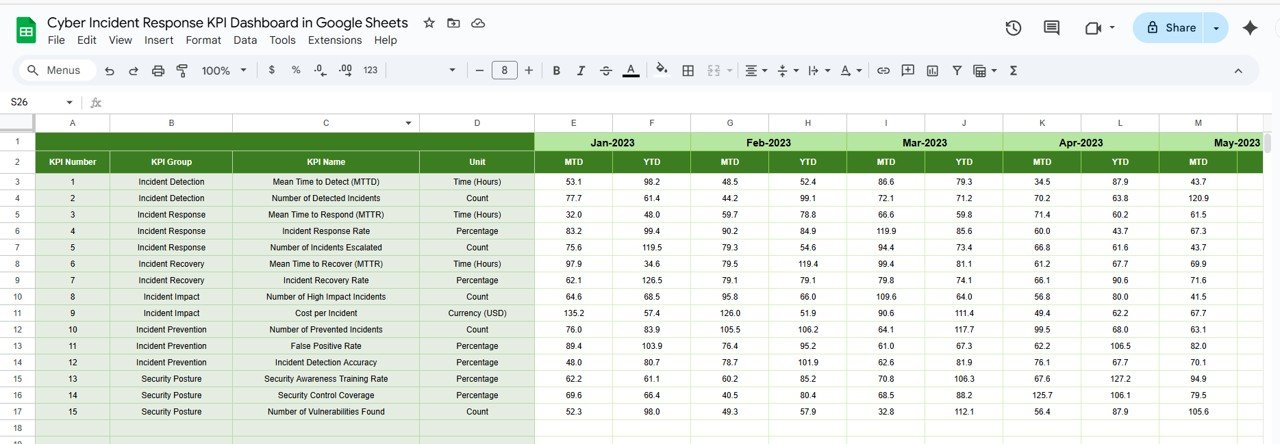
5. Previous Year Numbers Sheet Tab
Here, you can enter the previous year’s values for each KPI. This enables the dashboard to provide year-over-year comparisons, helping you evaluate improvements or declines.
Click to buy Cyber Incident Response KPI Dashboard in Google Sheets
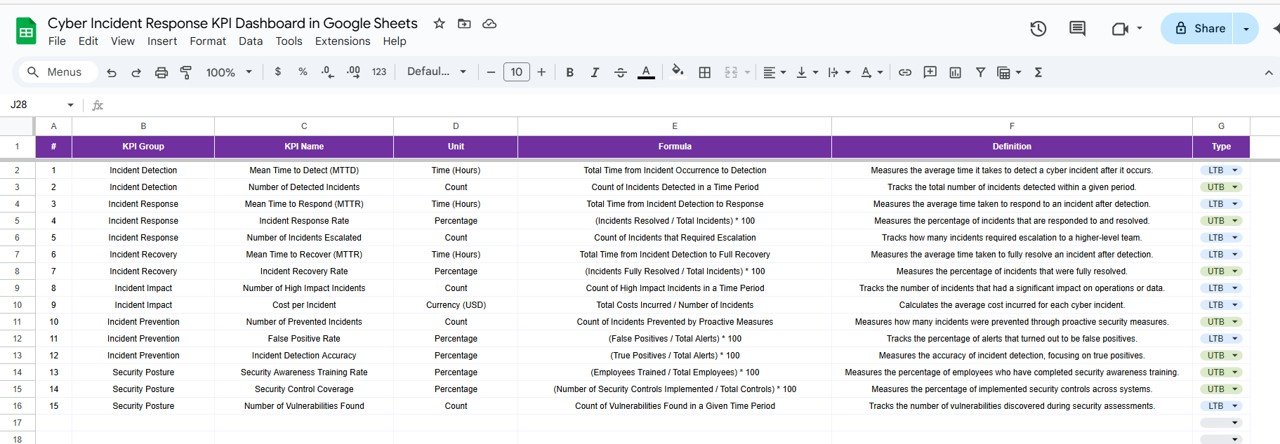
6. KPI Definition Sheet Tab
This is a reference tab that stores all essential information about each KPI. It includes:
-
KPI Name
-
KPI Group
-
Unit
-
Formula
-
Definition
-
Type (LTB or UTB)
This sheet ensures all stakeholders understand how each KPI is calculated and interpreted.Cyber Incident Response KPI Dashboard
Advantages of Using the Cyber Incident Response KPI Dashboard
Click to buy Cyber Incident Response KPI Dashboard in Google Sheets
-
Provides real-time visibility into your cybersecurity performance
-
Enables collaborative use by teams through Google Sheets’ sharing options
-
Reduces reliance on expensive or complex cybersecurity platforms
-
Helps track performance against SLAs and organizational goals
-
Easy to customize with your own KPIs, formulas, and visualizations
-
Encourages data-driven decisions for better incident response
-
Stores historical and current data in a structured, accessible format
Opportunities to Improve the Dashboard
-
Automate alerts for breached SLAs or poor-performing KPIs using Google Apps Script
-
Add a Google Form to allow users to submit incident data that feeds directly into the dashboard
-
Assign severity levels with weighted impact to prioritize critical incidents
-
Link the dashboard to external cybersecurity tools using API or CSV imports
-
Add fields to capture analyst comments or incident resolution summaries
-
Include cost impact fields to track financial implications of major incidents
Best Practices for Managing the KPI Dashboard
Click to buy Cyber Incident Response KPI Dashboard in Google Sheets
-
Assign one responsible person for each KPI to ensure accountability
-
Schedule monthly updates to keep data current and relevant
-
Use the KPI Trend sheet to identify patterns and recurring issues
-
Align KPI targets with internal or client SLAs to ensure performance
-
Present the dashboard during review meetings to drive actionable insights
-
Apply conditional formatting to highlight red flags and areas needing attention
-
Control access levels to protect sensitive security data and ensure data integrity
Conclusion
A Cyber Incident Response KPI Dashboard in Google Sheets is a powerful tool for any security team looking to track and improve their incident response capabilities. It provides a structured, scalable, and cost-effective solution that enables real-time monitoring, transparent reporting, and performance optimization.
With defined KPIs, automated comparisons, and interactive visualizations, this dashboard helps teams not only react to cyber threats but also prepare for and prevent them through continuous performance improvement.
Whether you’re managing a security team or reporting to executives, this dashboard gives you the insights and clarity you need to build a stronger cybersecurity posture.
Frequently Asked Questions (FAQs)
Click to buy Cyber Incident Response KPI Dashboard in Google Sheets
Q1. Can I add more KPIs to the dashboard?
Yes, you can update the KPI Definition sheet and extend the rows in the Actual, Target, and Previous Year tabs.
Q2. Is this dashboard suitable for non-technical users?
Yes, it’s designed to be simple. Basic spreadsheet knowledge is enough to use and manage it.
Q3. Can the dashboard be used across departments or teams?
Absolutely. You can add department fields and filter the data accordingly.
Q4. How can I automate data entry or alerts?
You can use Google Apps Script or integrations with tools like Google Forms or third-party APIs to automate updates.
Q5. How often should I update the dashboard?
It’s recommended to update it monthly for active tracking and quarterly for strategic reviews.Cyber Incident Response KPI Dashboard
Visit our YouTube channel to learn step-by-step video tutorials
Youtube.com/@NeotechNavigators
Watch the step-by-step video Demo:
Click to buy Cyber Incident Response KPI Dashboard in Google Sheets