Cybersecurity plays a major role in the survival of any modern business. Data breaches increase every year, and companies need strong visibility into how fast they detect, contain, respond, and recover from these threats. Because of this rising risk, organizations now depend on smart dashboards that track key cybersecurity metrics in real time. A Data Breach Response KPI Dashboard in Google Sheets gives teams a simple, powerful, and cost-effective way to monitor every stage of breach management without buying expensive tools.
This article explains everything about this dashboard in a clear and easy manner. You will understand all 20 KPIs, their formulas, their units, and their meaning. You will also learn about each sheet tab, the navigation flow, the analysis structure, advantages, improvement opportunities, best practices, and common FAQs. The goal is to help you use this dashboard to improve incident detection, reduce response time, and protect your organization from major risks.
Let’s start with the basics.
What Is a Data Breach Response KPI Dashboard in Google Sheets?
Click to Buy Data Breach Response KPI Dashboard in Google Sheets
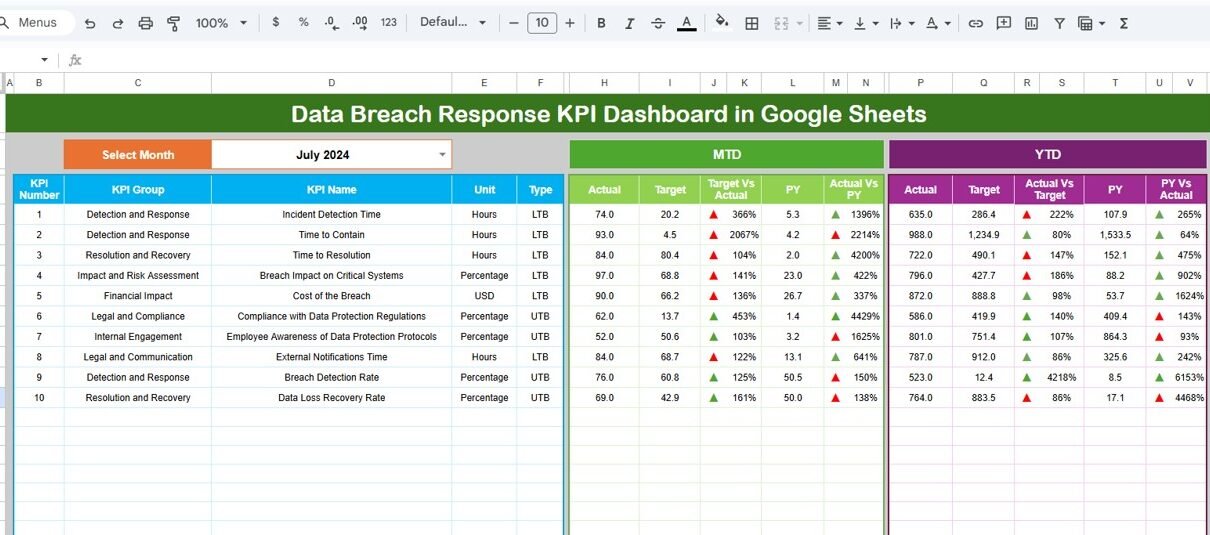
A Data Breach Response KPI Dashboard in Google Sheets is a ready-to-use reporting system that tracks critical metrics related to breach detection, containment, investigation, impact, recovery, and compliance. It works like a central real-time command center. As you update the actual numbers, targets, and previous-year data, the dashboard updates all KPI cards, trend charts, and comparison visuals automatically.
Teams prefer this Google Sheets-based dashboard because:
- It runs fully online.
- It updates instantly without coding.
- It works across devices.
- It requires no premium software.
- It supports interactive analysis.
Because it uses structured KPI definitions and clean data entry sheets, the dashboard becomes easy to maintain for any cybersecurity or IT team.
Key Worksheets of the Dashboard
The Data Breach Response KPI Dashboard in Google Sheets comes with 6 powerful sheets. Each sheet plays a special role.
1. Dashboard Sheet Tab (Main Page)
This is the core page of the entire system. Everything updates automatically based on the selected month in cell D3. When you select a month from the dropdown, all values recalculate for:
- MTD Actual
- MTD Target
- MTD Previous Year
- MTD Target vs Actual
- MTD PY vs Actual
- YTD Actual
- YTD Target
- YTD Previous Year
- YTD Target vs Actual
- YTD PY vs Actual
Conditional formatting adds up/down arrows to show performance trends.
Green arrows show improvement, while red arrows show issues.
Because all KPIs refresh instantly, this sheet becomes perfect for leadership reviews, daily monitoring, and incident performance assessment.

Click to Buy Data Breach Response KPI Dashboard in Google Sheets
2. KPI Trend Sheet Tab
In this sheet, you select a specific KPI from the dropdown in cell C3. The sheet displays:
- KPI Group
- Unit
- KPI Type (UTB or LTB)
- KPI Formula
- KPI Definition
It also shows month-wise trend charts to understand how the KPI changes across the year. This helps identify improvement areas, detect patterns, and analyze root causes.

3. Actual Number Sheet Tab
This sheet allows you to enter MTD and YTD actual numbers for each KPI.
You select the year’s first month in cell E1, and the sheet automatically aligns all following months.
You simply enter the values, and the dashboard updates automatically.

Click to Buy Data Breach Response KPI Dashboard in Google Sheets
4. Target Sheet Tab
This sheet stores monthly KPI targets for both MTD and YTD.
You can update targets at the beginning of each year or whenever the organization sets new performance goals.

5. Previous Year Number Sheet Tab
This sheet holds the previous year’s performance for all KPIs.
It enables a complete comparison between:
-
Current Year vs Previous Year
-
Month-on-Month improvement
-
Year-to-Date progress

Click to Buy Data Breach Response KPI Dashboard in Google Sheets
6. KPI Definition Sheet Tab
This sheet is the heart of the entire dashboard.
Here you maintain:
-
KPI Name
-
KPI Group
-
KPI Unit
-
KPI Formula
-
KPI Definition
-
KPI Type (Lower the Better or Upper the Better)
This ensures clarity and consistency for every team member who uses the dashboard.

Click to Buy Data Breach Response KPI Dashboard in Google Sheets
Advantages of the Data Breach Response KPI Dashboard
- Rapid Decision-Making: Managers get real-time visibility, so they take fast corrective actions.
- Better Incident Preparedness: Teams understand their weaknesses and fix them early.
- Improved Collaboration: Security, IT, Compliance, and Risk teams work on the same data.
- Higher Accuracy: Google Sheets automatically calculates KPIs, reducing manual errors.
- Real-Time Monitoring: Numbers update instantly as data changes.
- Zero Learning Curve: Anyone who knows Sheets can use the dashboard.
- Flexible and Customizable: You can modify KPIs, definitions, groups, and units anytime.
Opportunities for Improvement in Data Breach Response
Even a powerful KPI dashboard needs regular enhancement. Here are improvement areas:
- Add Automated Alerts: Link the Sheet with tools like Gmail or Apps Script for auto-notifications.
- Add Granular Root-Cause Data: Enhance investigation quality with deeper cause tracking.
- Integrate Threat Intelligence Feeds: Add external threat information for forecasting attacks.
- Include Department-Wise KPIs: rack which teams cause or resolve more incidents.
- Add Real-Time Data Imports: Use API connectors for importing SIEM logs automatically.
- Introduce Incident Severity Levels: Classify events as Low, Medium, or High severity.
Best Practices for Using This Dashboard
Click to Buy Data Breach Response KPI Dashboard in Google Sheets
- Update Data Monthly Without Delay: Enter actual numbers as soon as the month closes.
- Review KPI Trends, Not Just Monthly Values: Trends show deeper behavior patterns.
- Set Challenging but Achievable Targets; Targets must push teams but remain realistic.
- Train Teams on KPI Definitions: Everyone must understand each KPI clearly.
- Use Conditional Formatting Smartly: Arrows show performance quickly during reviews.
- Protect Data with Role-Based Access: Give edit rights only to authorized team members.
- Review Previous-Year Comparison Every Quarter: This shows long-term improvement or decline.
Conclusion
A Data Breach Response KPI Dashboard in Google Sheets helps every organization protect its digital assets and respond to threats with greater speed. It improves incident detection, containment, and recovery while giving leadership a complete view of cybersecurity readiness. Because the dashboard is simple, online, and fully automated, it becomes easy to use for any business size. When combined with clear KPIs, strong processes, and consistent updates, this dashboard becomes a powerful cybersecurity intelligence tool.
Frequently Asked Questions (FAQs)
Click to Buy Data Breach Response KPI Dashboard in Google Sheets
1. What is the purpose of a Data Breach Response Dashboard?
It monitors all key incident-response metrics in one place and improves decision-making.
2. Is Google Sheets reliable for cybersecurity dashboards?
Yes, because it offers real-time updates, online access, and zero setup cost.
3. How many KPIs should a breach dashboard have?
Most dashboards use 15–25 KPIs for complete coverage.
4. Can I add more KPIs later?
Yes, the dashboard is fully customizable.
5. Who uses this dashboard?
Cybersecurity teams, IT teams, compliance officers, and risk managers.
6. Do I need coding skills?
No, the dashboard works without coding.
7. Can I link this dashboard with other tools?
Yes, using Google Apps Script or automation tools.
Visit our YouTube channel to learn step-by-step video tutorials
Youtube.com/@NeotechNavigators
Watch the step-by-step video tutorial:
Click to Buy Data Breach Response KPI Dashboard in Google Sheets