In today’s competitive healthcare industry, every dental practice needs to monitor its performance continuously. Patient care, staff efficiency, treatment costs, and appointment management all affect profitability and service quality. However, tracking these aspects manually can be time-consuming and prone to errors.
That’s where the Dental Practice KPI Dashboard in Google Sheets becomes a game-changer. This ready-to-use, interactive dashboard helps dental professionals analyze, visualize, and improve their key performance indicators (KPIs) with ease. It simplifies data management, enhances decision-making, and ensures that the entire dental team stays aligned with business goals.
Click to buy Dental Practice KPI Dashboard in Google Sheets
What Is a Dental Practice KPI Dashboard in Google Sheets?
A Dental Practice KPI Dashboard in Google Sheets is a smart, data-driven solution that organizes and tracks performance metrics for your dental clinic. It converts daily operational data into easy-to-read charts and visuals. With this dashboard, you can monitor essential KPIs such as patient visits, treatment success rates, revenue growth, and staff productivity — all in one place.
Using Google Sheets ensures that the dashboard is cloud-based, collaborative, and accessible from anywhere. You don’t need expensive software or complex coding skills. You simply input your data, and the dashboard automatically updates the visuals and KPIs.
Structure of the Dental Practice KPI Dashboard
This Google Sheets dashboard includes six interactive worksheets, each designed to capture and analyze different aspects of your dental clinic’s operations.
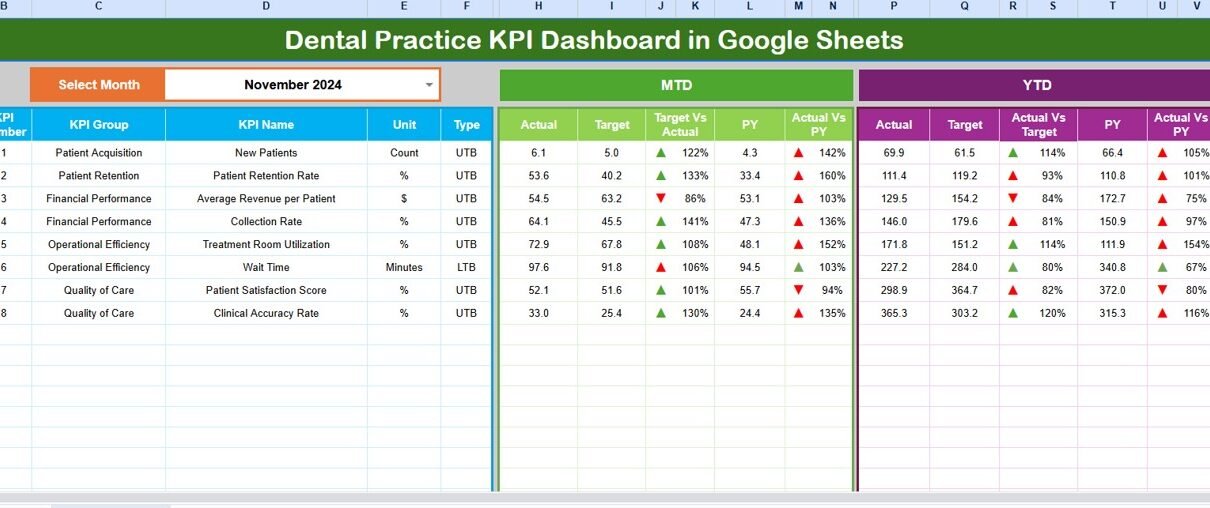
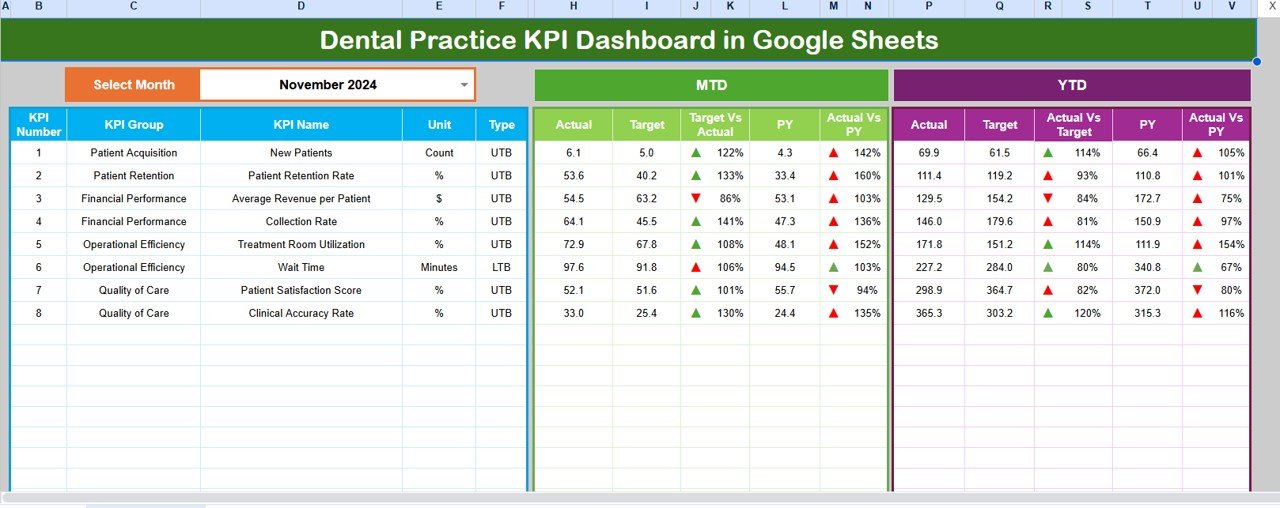
Dashboard Sheet Tab
This is the main page of the dashboard and serves as the central hub for analysis.
- In cell D3, you can select the month from a drop-down list.
- The entire dashboard automatically updates based on your selection.
- It displays Month-to-Date (MTD) and Year-to-Date (YTD) metrics such as Actual, Target, and Previous Year values.
- You can easily compare Target vs. Actual and Previous Year vs. Actual results.
- Conditional formatting adds visual arrows (↑ or ↓) to highlight performance trends instantly.
This sheet gives a complete view of your clinic’s performance across all KPIs.
Click to buy Dental Practice KPI Dashboard in Google Sheets
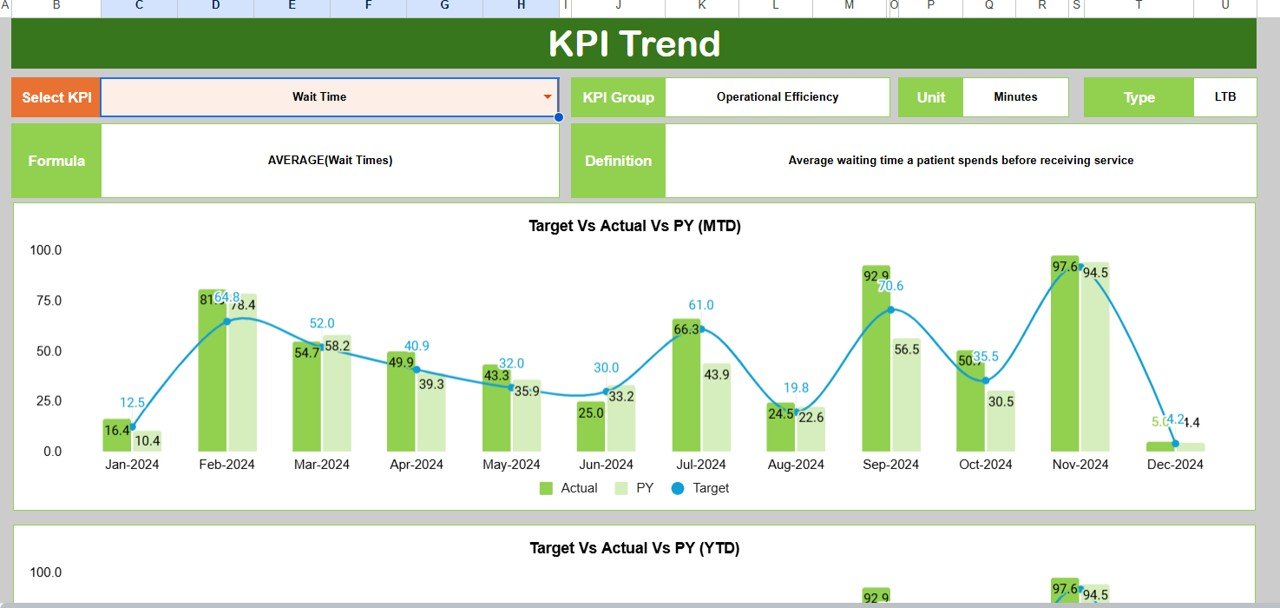
KPI Trend Sheet Tab
This worksheet tracks how each KPI changes over time.
- Select a KPI name from the drop-down list in cell C3.
- It displays detailed information including KPI Group, Unit, Type (UTB or LTB), Formula, and Definition.
- You can visualize the MTD and YTD performance trends for Actual, Target, and Previous Year.
This makes it easy to understand whether performance is improving or declining across months.
Click to buy Dental Practice KPI Dashboard in Google Sheets
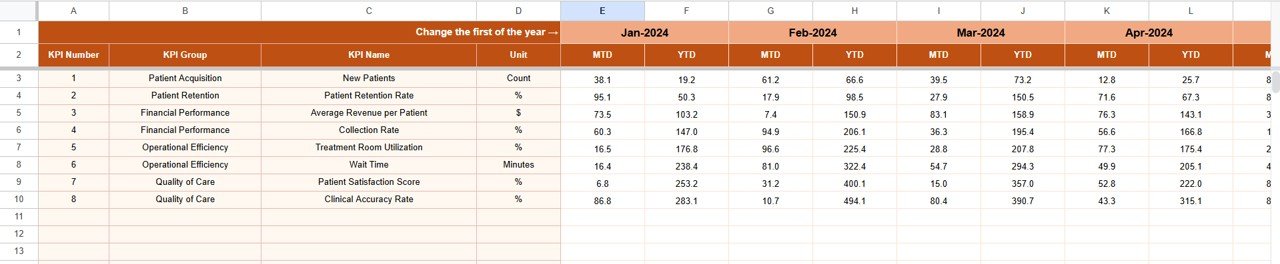
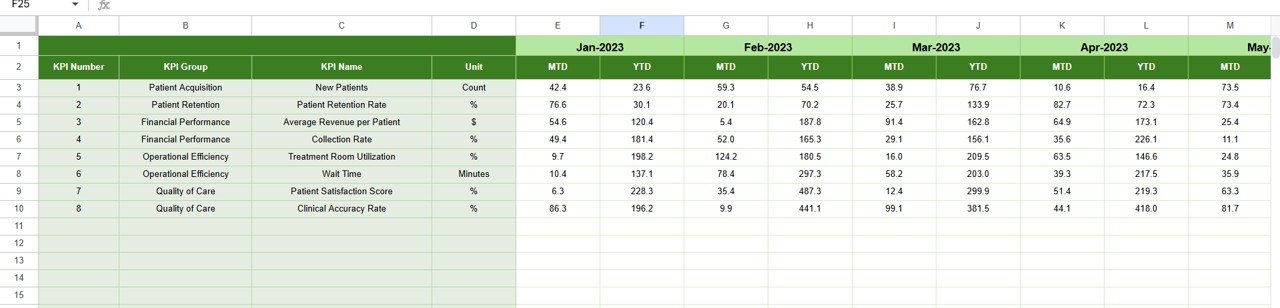
Actual Numbers Input Sheet Tab
Here, you can enter your monthly actual figures for each KPI.
- The month displayed is based on cell E1 — simply enter the first month of your fiscal year.
- The dashboard automatically calculates and updates trends and comparisons.
This sheet is the heart of your real-time data collection.
Target Sheet Tab
Every dental practice has performance goals.
- In this tab, you define the MTD and YTD target values for each KPI.
- The dashboard uses these targets to evaluate whether the clinic is meeting expectations or needs improvement.
Click to buy Dental Practice KPI Dashboard in Google Sheets
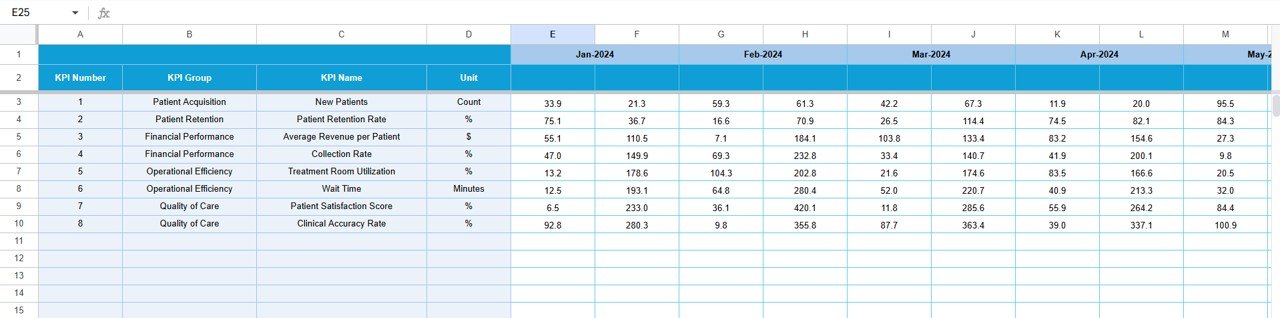
Previous Year Numbers Sheet Tab
To measure growth accurately, you must compare the current performance with historical data.
- This tab allows you to input previous year’s actual values for every KPI.
- It helps in year-over-year (YoY) analysis and growth tracking.
Click to buy Dental Practice KPI Dashboard in Google Sheets
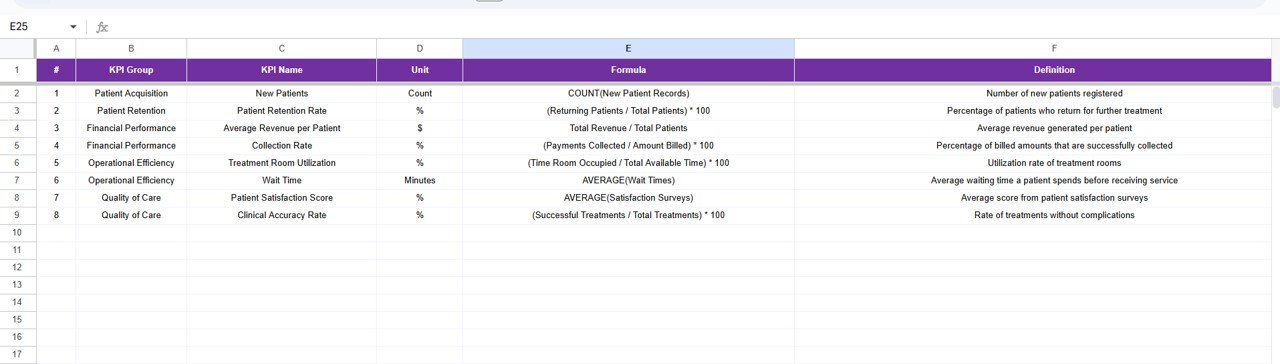
KPI Definition Sheet Tab
This tab provides the reference for every KPI used in the dashboard.
- You can list KPI Name, KPI Group, Unit, Formula, and Definition.
- It ensures clarity across the team and helps in consistent reporting.
Click to buy Dental Practice KPI Dashboard in Google Sheets
Key KPIs to Track in a Dental Practice Dashboard
The effectiveness of any dashboard depends on the right KPIs. Below are the most relevant KPIs you can include in your dental practice dashboard:
- Patient Appointments Booked
- Patient No-Show Rate
- Treatment Success Rate (%)
- Revenue per Patient
- New Patient Growth Rate
- Chair Utilization Rate (%)
- Average Treatment Duration
- Total Treatment Cost
- Operating Expense Ratio
- Staff Productivity (%)
- Patient Satisfaction Score
- Net Profit Margin (%)
These KPIs provide a balanced view of clinical, operational, and financial performance.
Why Every Dental Clinic Needs a KPI Dashboard
Running a dental practice is more than treating patients. You must also manage operations efficiently, control costs, and maintain patient satisfaction. A KPI dashboard bridges the gap between clinical excellence and business success.
Here’s why you should implement one:
- Improved Decision-Making
You can make quick, data-driven decisions by visualizing real-time data instead of relying on assumptions.
- Enhanced Financial Control
Tracking revenue, expenses, and profit margins helps you maintain a healthy financial balance.
- Operational Transparency
Everyone in the team can see how the clinic performs. This promotes accountability and collaboration.
- Better Patient Experience
By tracking satisfaction scores and feedback trends, you can identify improvement areas instantly.
- Time Efficiency
Automated charts and calculations reduce manual reporting, saving hours of administrative effort.
How the Dental Practice KPI Dashboard Works
The dashboard combines formulas, charts, and automation to give you a complete performance snapshot.
- You input your data in the Actual, Target, and Previous Year tabs.
- The Dashboard sheet automatically updates visuals and KPI cards.
- The Trend sheet generates time-based graphs to track progress.
- Conditional formatting uses color codes and arrows to show whether KPIs are improving or declining.
All calculations and visual updates happen in real time without any extra setup.
Advantages of the Dental Practice KPI Dashboard
The Dental Practice KPI Dashboard in Google Sheets offers multiple benefits that extend beyond tracking numbers. Here’s what makes it essential for modern dental practices:
- Real-Time Data Insights
The dashboard provides instant access to live performance data so you can respond quickly to changes.
- Cloud-Based Collaboration
Multiple users can view and update the dashboard simultaneously from any device.
- Cost-Effective Solution
Unlike premium BI tools, Google Sheets offers all core functionality without heavy licensing costs.
- Easy Customization
You can easily add or remove KPIs, modify charts, and tailor the dashboard to your practice.
- Improved Accountability
Everyone on the team knows the targets and results, which encourages consistent performance.
- Enhanced Forecasting
Historical data helps you forecast future performance trends with confidence.
Best Practices for Using the Dental Practice KPI Dashboard
To get the most out of your KPI dashboard, follow these best practices:
1. Keep Data Updated Regularly
Update actual and target numbers monthly or weekly for accurate tracking.
2. Define Clear KPIs
Use measurable and relevant KPIs aligned with your business goals — not vanity metrics.
3. Train Staff on Dashboard Usage
Ensure your administrative and clinical teams understand how to read and use the data.
4. Review Trends, Not Just Snapshots
Focus on long-term patterns rather than daily variations for better decision-making.
5. Set Realistic Targets
Targets should challenge the team without being impossible to achieve.
6. Automate Where Possible
Use Google Sheets formulas and conditional formatting to minimize manual effort.
7. Maintain Data Accuracy
Check for missing or incorrect data regularly to ensure valid results.
How to Implement the Dashboard Step-by-Step
Setting up the Dental Practice KPI Dashboard in Google Sheets is straightforward:
- ive results — the charts, conditional formatting, and KPI cards will refresh automatically.
- Share wit
- Download the template.
- Open the file in Google Sheets and go to the KPI Definition tab to review existing metrics.
- Enter your data in the Actual, Target, and Previous Year sheets.
- Select your month from the drop-down on the Dashboard sheet.
- Observe l
- h your team for collaboration and performance tracking.
Customizing the Dashboard for Your Clinic
Every dental clinic has unique priorities. You can easily tailor the dashboard to match your goals.
- Add new KPIs like “Average Treatment Cost per Patient” or “Patient Wait Time.”
- Insert new charts such as pie charts for department-wise cost distribution.
- Use data validation lists to manage treatments or services dynamically.
- Apply custom color schemes for brand alignment.
With Google Sheets’ flexibility, customization takes minutes instead of hours.
Real-World Applications
The Dental Practice KPI Dashboard isn’t just for clinics — it benefits a range of users:
- Solo Practitioners: Track individual efficiency and revenue growth.
- Multi-Branch Clinics: Compare performance across locations.
- Dental Groups: Monitor staff utilization, patient experience, and profitability.
- Administrative Teams: Manage expenses, appointments, and treatment data in real time.
This versatility makes it one of the most practical tools for healthcare data management.
Who Can Benefit from This Dashboard?
- Dentists who want clear insights into operational and financial performance.
- Practice Managers who need an overview of patient trends and staff utilization.
- Financial Controllers looking for accurate profitability data.
- Marketing Teams monitoring new patient acquisition and retention rates.
- Clinic Owners aiming for strategic growth with data-backed decisions.
🧭 Comparison: Google Sheets vs. Other Tools
🧩 Future Enhancements You Can Add
- Automate data entry using Google Forms for appointment logs.
- Integrate with Google Data Studio for advanced visuals.
- Add KPI benchmarking for multi-clinic comparisons.
- Enable email alerts for KPIs falling below targets.
These enhancements can make the dashboard even more powerful and proactive.
Conclusion
The Dental Practice KPI Dashboard in Google Sheets is an indispensable tool for modern dental clinics. It helps you track key performance metrics, identify problem areas, and make timely improvements. From patient satisfaction to revenue management, it turns data into actionable insights that drive sustainable growth.
By adopting this dashboard, you move beyond guesswork and toward data-driven excellence. Your clinic becomes more organized, efficient, and focused on what truly matters — delivering exceptional dental care while maintaining business profitability.
Frequently Asked Questions (FAQs)
- What is a Dental Practice KPI Dashboard?
It’s a structured Google Sheets template that tracks performance indicators like patient volume, revenue, and satisfaction to help clinics improve decision-making.
- Is this dashboard easy to use?
Yes! The interface is simple, and you can use drop-down selections and charts without technical skills.
- Can I customize the KPIs?
Absolutely. You can edit the KPI Definition sheet to add, rename, or remove KPIs as per your clinic’s goals.
- How often should I update the data?
Ideally, update it monthly to maintain accurate performance tracking and trend analysis.
- Does it work for multi-clinic setups?
Yes. You can add location-wise data to compare multiple branches or departments.
- What’s the main benefit of using this dashboard?
It helps dental clinics improve efficiency, monitor performance in real time, and make informed strategic decisions.
Visit our YouTube channel to learn step-by-step video tutorials
Youtube.com/@NeotechNavigators