In the fast-paced world of digital marketing, tracking and optimizing campaigns is crucial to maximize ROI. Our Digital Advertising KPI Dashboard in Google Sheets is a ready-to-use solution designed to help marketers, analysts, and business owners monitor key performance indicators, analyze trends, and make data-driven decisions.Digital Advertising KPI Dashboard in Google Sheets
This dashboard consolidates all critical digital advertising metrics in one interactive Google Sheets template. It allows users to track monthly and yearly performance, compare actual results against targets, and evaluate KPIs with clear indicators for improvement.Digital Advertising KPI Dashboard in Google Sheets
Key Features of Digital Advertising KPI Dashboard in Google Sheets
This dashboard consists of six worksheets, each serving a specific purpose:
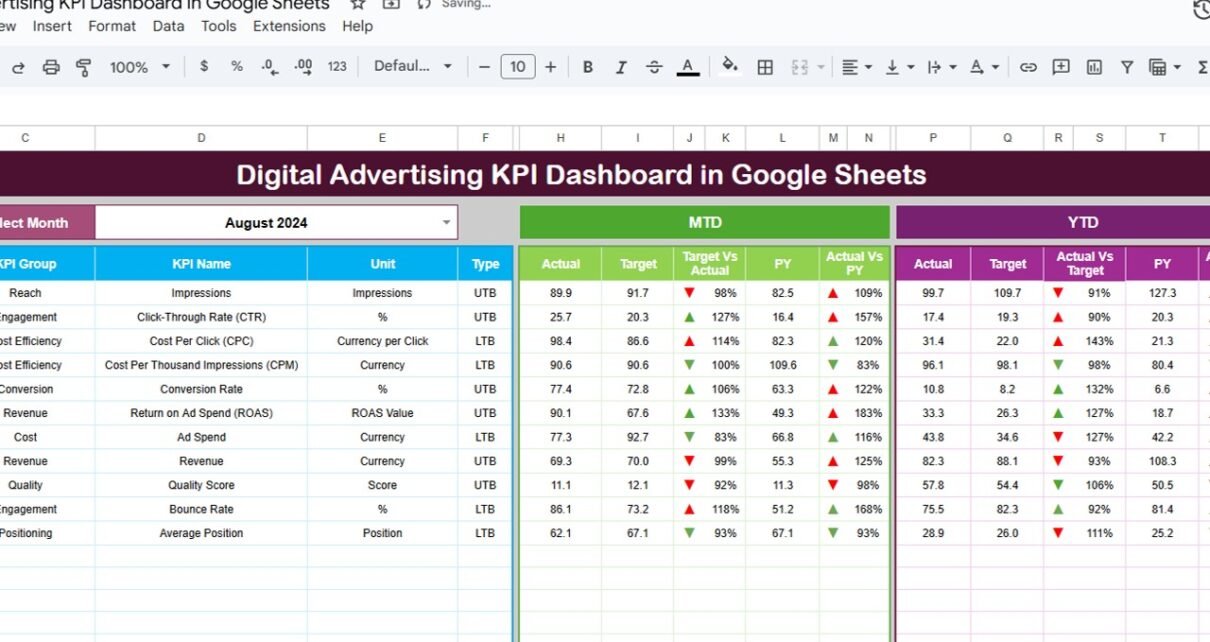
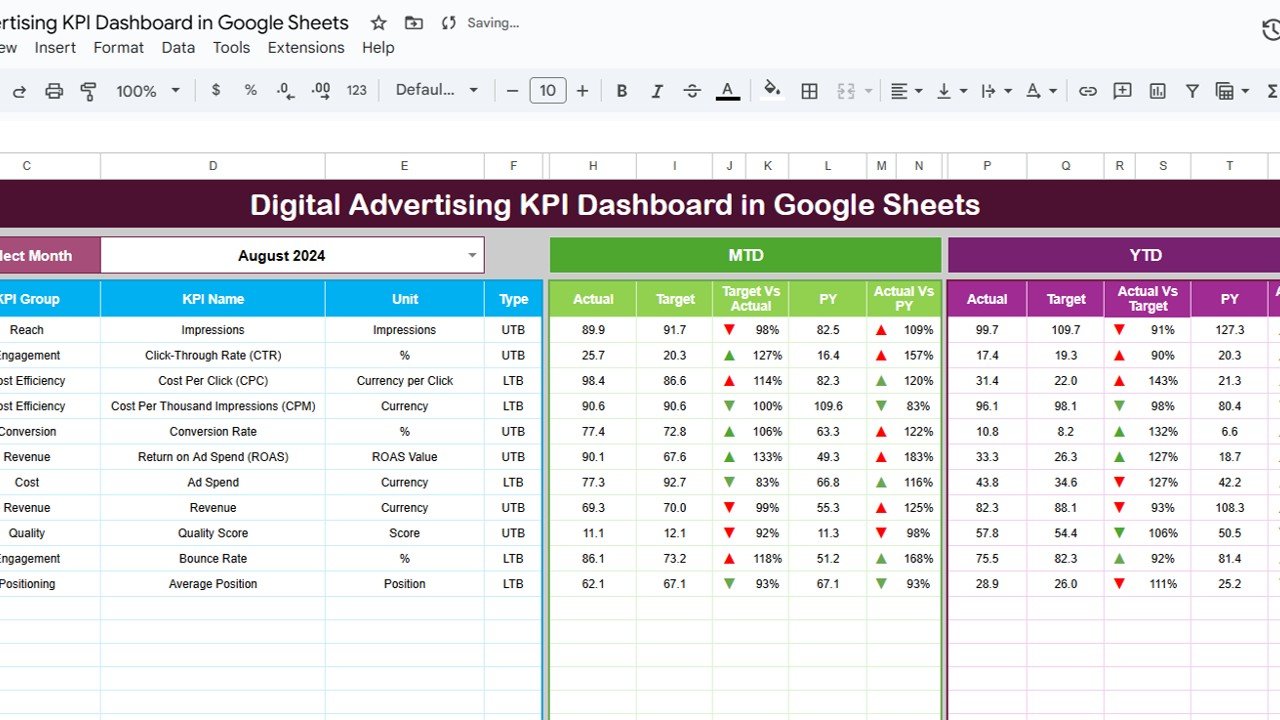
1. Dashboard Sheet Tab
The Dashboard Sheet is the main interface for reviewing all KPI data.
Features:
-
Month Selection: Use the dropdown on D3 to select any month; all numbers update automatically
-
MTD Data: Shows actual, target, and previous year metrics, along with Target vs Actual and PY vs Actual comparisons using conditional formatting (up/down arrows)
-
YTD Data: Displays cumulative performance metrics for the year with similar comparisons and conditional formatting
-
Visual Indicators: Quickly identify KPIs that are underperforming or exceeding expectations
This sheet provides a clear snapshot of the campaign’s performance at a glance.
Click to Buy Digital Advertising KPI Dashboard in Google Sheets
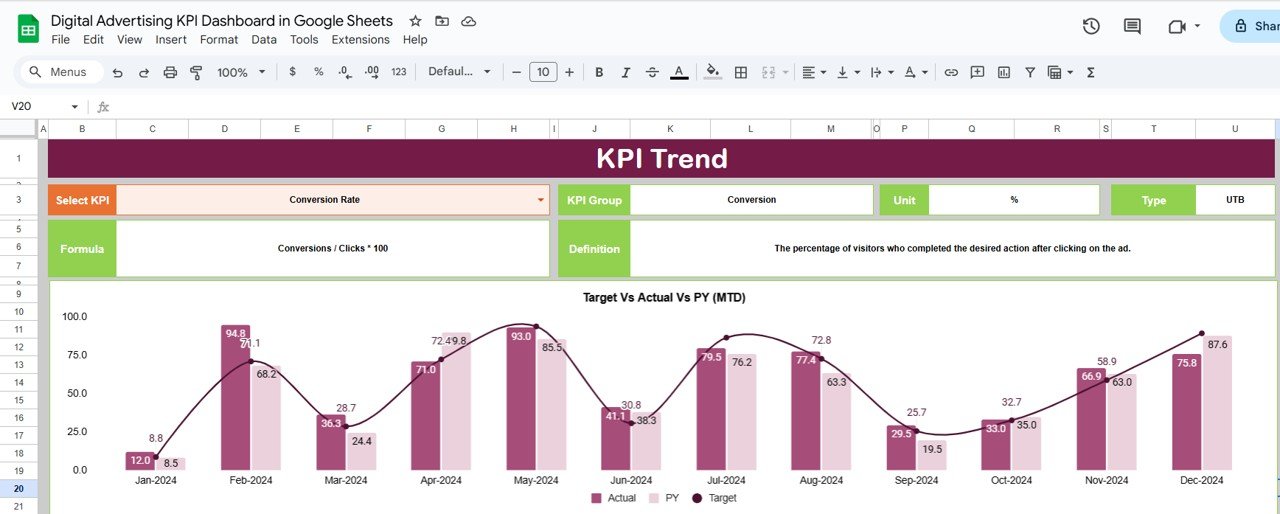
2. KPI Trend Sheet Tab
The KPI Trend Sheet allows a detailed view of individual KPIs.
Features:
-
KPI Selection: Choose a KPI from the dropdown in C3
-
KPI Details: Displays KPI Group, Unit, Type (Lower the Better / Upper the Better), formula, and definition
-
Trend Analysis: Track KPI performance trends over time to identify patterns and optimize campaigns\
Click to Buy Digital Advertising KPI Dashboard in Google Sheets
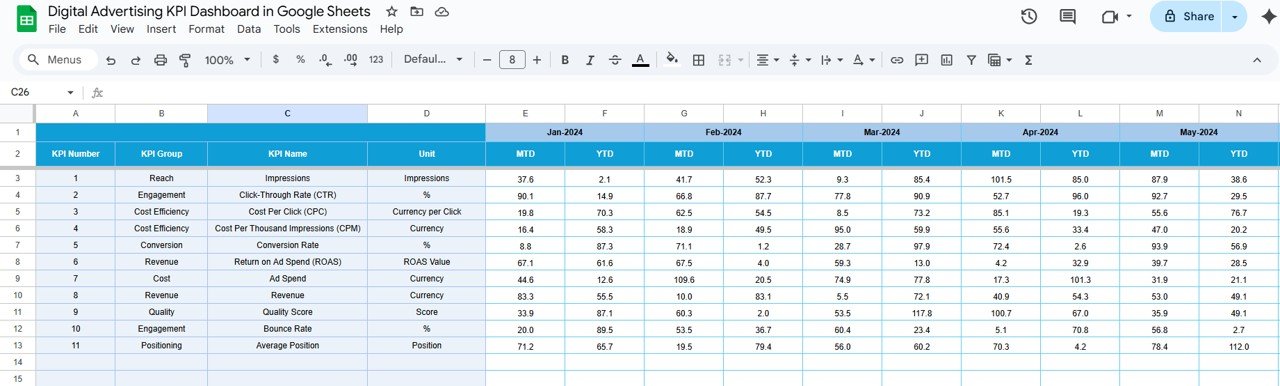
3. Actual Number Sheet Tab
The Actual Number Sheet is where you input the real performance metrics:
-
Enter MTD and YTD actual numbers for each KPI
-
Update the month from E1 to reflect the first month of the year
-
All dashboard charts and calculations update automatically based on this data
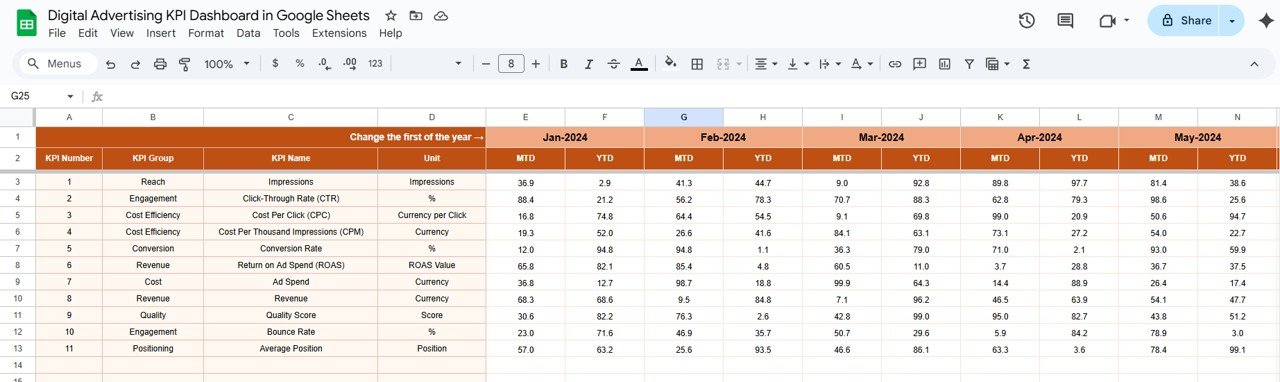
4. Target Sheet Tab
The Target Sheet is used to set monthly and cumulative KPI targets:
-
Input MTD and YTD targets for each KPI
-
Provides a benchmark for evaluating actual performance and highlighting gaps
Click to Buy Digital Advertising KPI Dashboard in Google Sheets
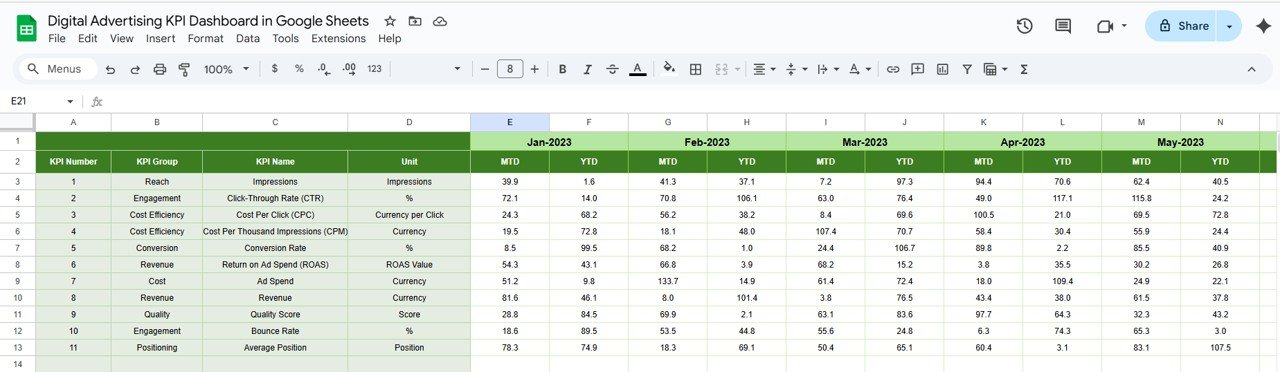
5. Previous Year Number Sheet Tab
The Previous Year Sheet stores last year’s performance metrics:
-
Input historical MTD and YTD data
-
Enables comparison with the current year to track growth and identify areas needing improvement
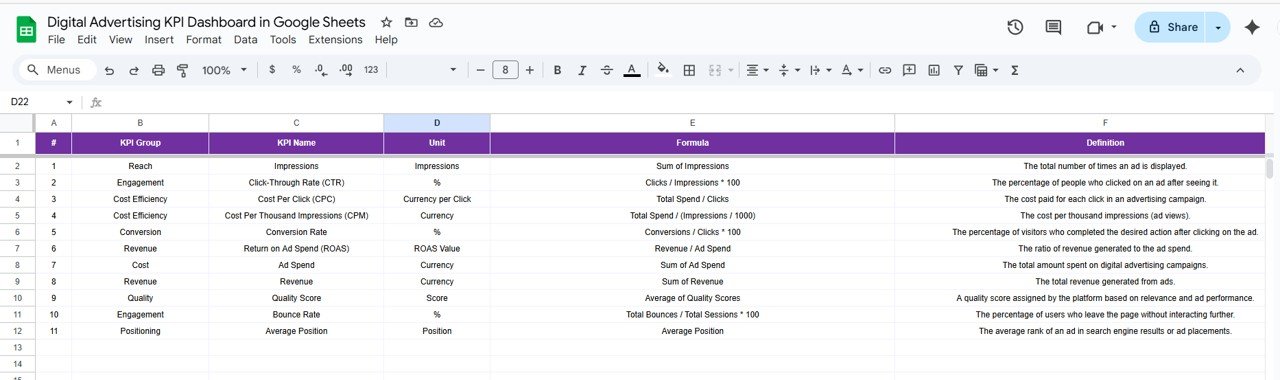
6. KPI Definition Sheet Tab
The KPI Definition Sheet is the master reference table:
-
Record KPI Name, KPI Group, Unit, Formula, and KPI Definition
-
Mark each KPI as Lower the Better (LTB) or Upper the Better (UTB)
-
Ensures consistency in KPI tracking and reporting
Click to Buy Digital Advertising KPI Dashboard in Google Sheets
Advantages of Using This Dashboard
-
Comprehensive Overview: Track all key digital advertising metrics in one place
-
Real-Time Insights: Update actuals and targets to instantly see performance
-
Comparative Analysis: Compare current performance with past periods and targets
-
Clear Visual Indicators: Conditional formatting highlights KPIs that need attention
-
Flexible & Scalable: Works for any size of digital campaigns, from small startups to large enterprises
Opportunities for Improvement
Click to Buy Digital Advertising KPI Dashboard in Google Sheets
-
Integration with Ad Platforms: Connect to Google Ads, Facebook Ads, or LinkedIn Ads for automated data updates
-
Predictive Analytics: Forecast future KPI performance using historical trends
-
Custom Alerts: Create alerts for underperforming KPIs using conditional formatting or Google Apps Script
-
Campaign Segmentation: Track KPIs by campaign type, audience, or platform
-
Enhanced Visualization: Add charts, graphs, and sparklines for more interactive insights
Best Practices for Using This Dashboard
-
Regular Updates: Input actual data monthly to keep the dashboard accurate
-
Set Realistic Targets: Align KPI targets with business objectives and historical performance
-
Monitor Trends: Use KPI Trend Sheet to identify patterns and optimize campaigns
-
Prioritize Metrics: Focus on KPIs that directly impact ROI, such as CTR, Conversion Rate, and Cost per Acquisition
-
Share Insights: Regularly share dashboard findings with marketing and management teams for collaborative decision-making
Conclusion
Click to Buy Digital Advertising KPI Dashboard in Google Sheets
The Digital Advertising KPI Dashboard in Google Sheets is an essential tool for marketers and analysts who want to streamline campaign tracking, monitor performance, and improve ROI. With interactive sheets, clear KPI definitions, and dynamic monthly and yearly comparisons, this dashboard provides actionable insights to drive smarter decisions in digital marketing.Digital Advertising KPI Dashboard in Google Sheets
FAQs Digital Advertising KPI Dashboard in Google Sheets
1. Can I track multiple campaigns with this dashboard?
Yes, you can enter separate KPIs for each campaign and monitor performance in the same dashboard.
2. Does the dashboard support monthly and yearly comparisons?
Absolutely, the dashboard shows both MTD and YTD data with target and previous year comparisons.
3. Can I add custom KPIs?
Yes, the KPI Definition Sheet allows you to define new KPIs, their formula, unit, and whether higher or lower values are better.
4. Is it suitable for any digital advertising platform?
Yes, it’s platform-agnostic and can track KPIs from Google Ads, Facebook, LinkedIn, YouTube, and more.
5. How do conditional formatting arrows work?
Up/down arrows indicate whether a KPI is performing better or worse than its target or previous year, based on the LTB/UTB type.
Visit our YouTube channel to learn step-by-step video tutorials
Youtube.com/@NeotechNavigators
Watch the step-by-step video Demo:
Click to Buy Digital Advertising KPI Dashboard in Google Sheets