Managing distributor performance plays a critical role in building a successful sales and supply chain network. Companies depend on distributors to deliver products efficiently, achieve sales targets, maintain inventory flow, and expand market reach. However, many organizations still track distributor performance using scattered spreadsheets and manual reports. As a result, performance visibility becomes limited and decision-making slows down.Distributor Performance KPI Dashboard in Google Sheets
Therefore, businesses now adopt data-driven solutions to monitor distributor efficiency accurately. One powerful solution is the Distributor Performance KPI Dashboard in Google Sheets, a ready-to-use analytical dashboard designed to track distributor KPIs using automated calculations and dynamic reporting.Distributor Performance KPI Dashboard in Google Sheets
In this article, we will explain the Distributor Performance KPI Dashboard in Google Sheets, including KPIs, dashboard structure, worksheets, features, advantages, and best practices for implementation.Distributor Performance KPI Dashboard in Google Sheets
What Is a Distributor Performance KPI Dashboard in Google Sheets?
A Distributor Performance KPI Dashboard in Google Sheets is an interactive performance monitoring system that helps organizations measure distributor efficiency using Key Performance Indicators (KPIs).
Instead of manually analyzing sales and distribution data, managers monitor performance through visual dashboards that automatically update based on selected months.
This dashboard helps organizations:
- Monitor distributor sales performance
- Compare targets vs actual achievements
- Track monthly and yearly performance trends
- Evaluate growth against previous year data
- Measure operational efficiency
- Improve distributor accountability
Consequently, companies gain better control over their distribution network.
Why Is Distributor Performance Tracking Important?
Click to Buy Distributor Performance KPI Dashboard in Google Sheets
Distributor networks directly influence revenue growth and market expansion. However, without structured monitoring, companies face several challenges.
Common Problems Without KPI Tracking
- Lack of performance visibility
- Missed sales targets
- Poor demand planning
- Inefficient distributor evaluation
- Delayed corrective actions
- Inconsistent reporting methods
Therefore, organizations require a centralized KPI dashboard to analyze performance consistently.
Key Features of Distributor Performance KPI Dashboard in Google Sheets
The dashboard provides automated KPI monitoring with dynamic monthly analysis.
Major Functional Highlights
- Month selection dropdown (Range D3)
- Automatic KPI calculation
- MTD and YTD performance tracking
- Target vs Actual comparison
- Previous Year comparison
- Conditional formatting indicators
- KPI trend analysis
- Centralized KPI definition management
Because the dashboard updates automatically, users analyze distributor performance instantly.
Dashboard Structure – Worksheets Overview
The Distributor Performance KPI Dashboard contains six structured worksheets, each serving a specific analytical purpose.
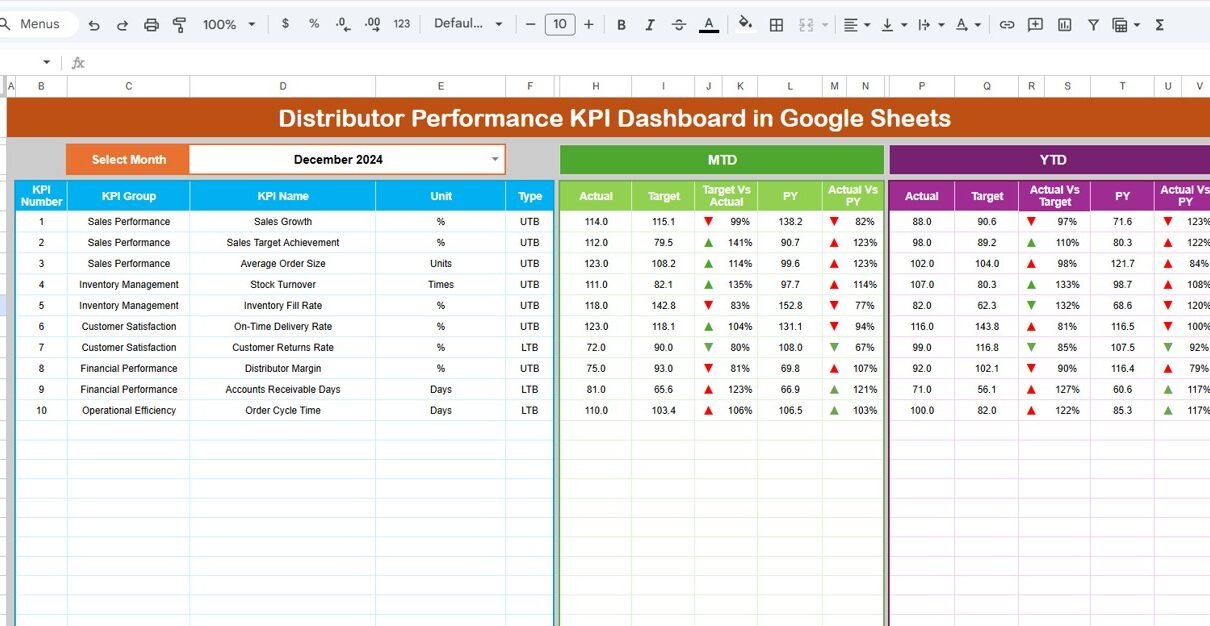
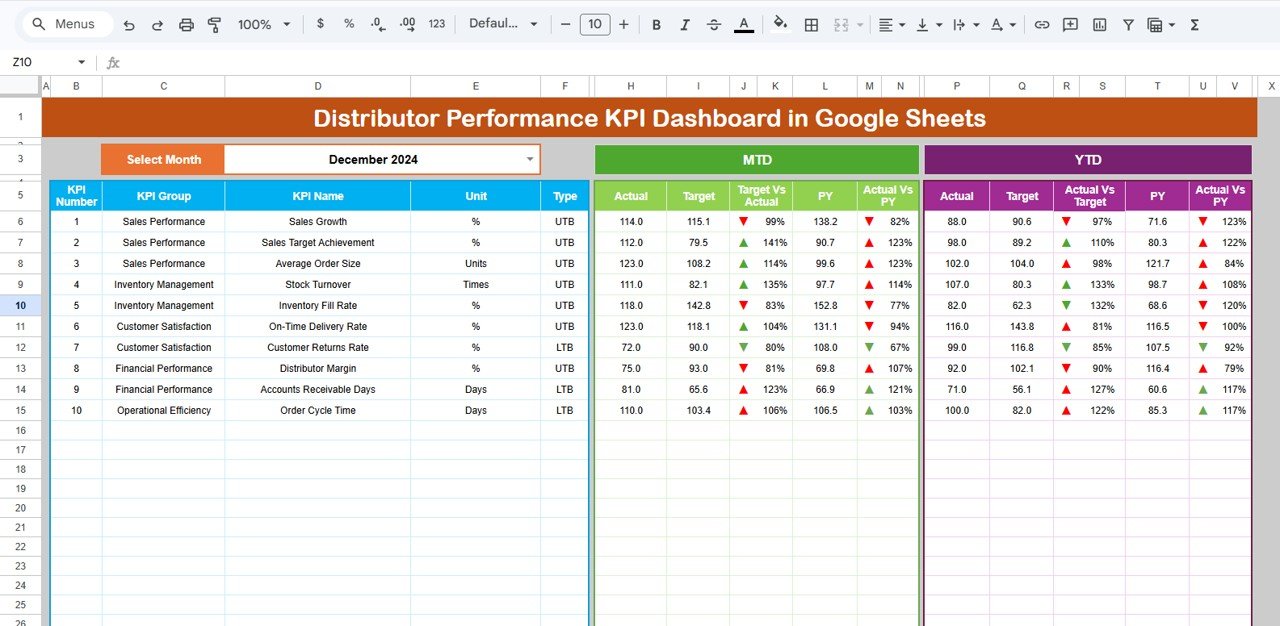
1. Dashboard Sheet Tab – Main Performance Overview
Click to Buy Distributor Performance KPI Dashboard in Google Sheets
This is the primary dashboard page where all KPIs appear together.
Key Functionality
On Range D3, users select the month using a dropdown. Once selected, the entire dashboard updates automatically.
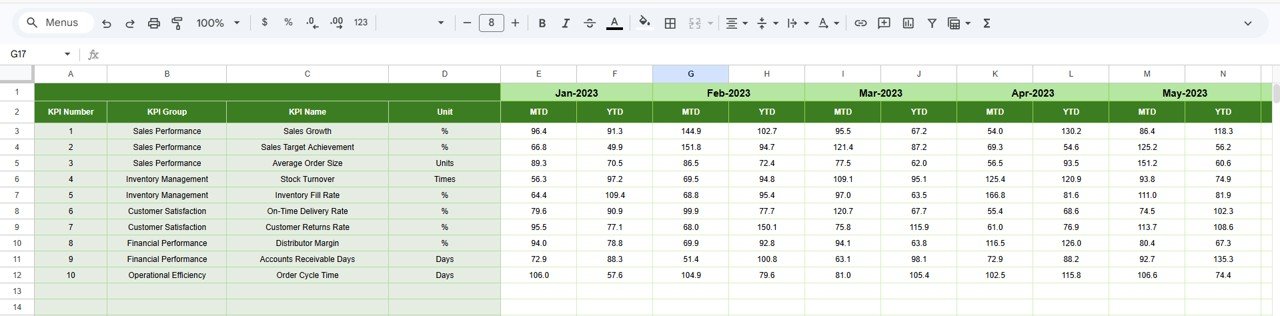
Metrics Displayed
MTD (Month-To-Date)
- Actual Value
- Target Value
- Previous Year Value
- Target vs Actual comparison
- Previous Year vs Actual comparison
YTD (Year-To-Date)
- Actual Performance
- Target Performance
- Previous Year Performance
- Variance indicators
Conditional formatting arrows visually indicate performance:
- Green Arrow → Performance Improved
- Red Arrow → Performance Declined
Therefore, managers quickly understand distributor performance trends.
Click to Buy Distributor Performance KPI Dashboard in Google Sheets
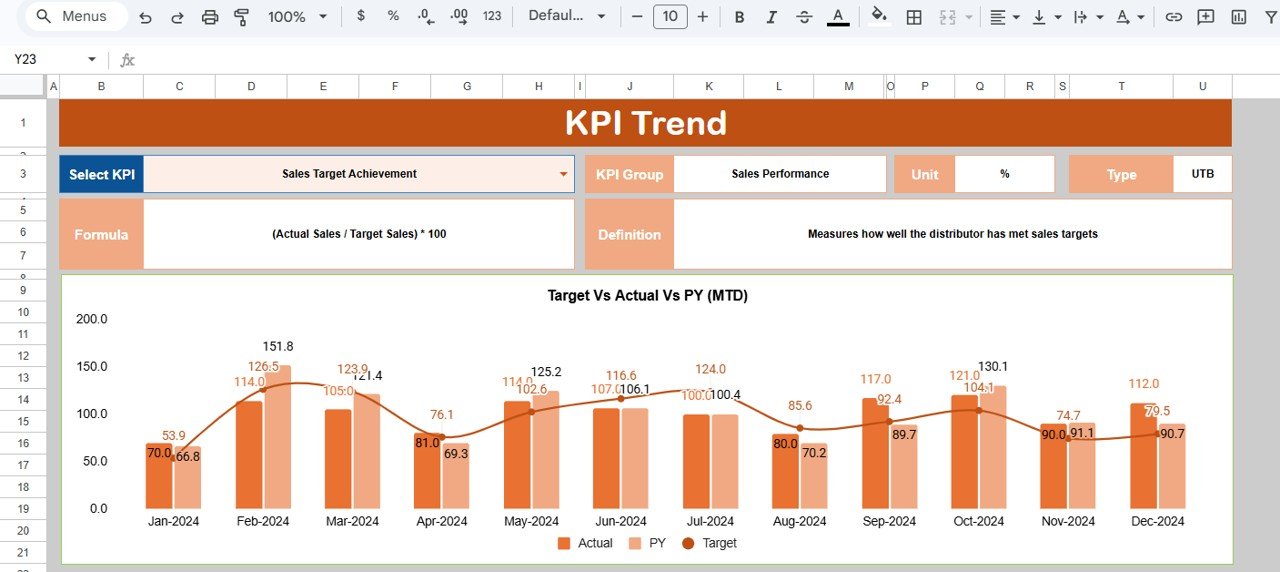
2. KPI Trend Sheet Tab – KPI Performance Analysis
This sheet provides detailed KPI-level insights.
Features Available
Users select a KPI from dropdown Range C3, and the sheet displays:
-
KPI Group
-
KPI Unit
-
KPI Type (Lower the Better / Upper the Better)
-
KPI Formula
-
KPI Definition
Additionally, trend visuals show performance movement across months.
As a result, teams analyze individual KPI behavior easily.
Click to Buy Distributor Performance KPI Dashboard in Google Sheets
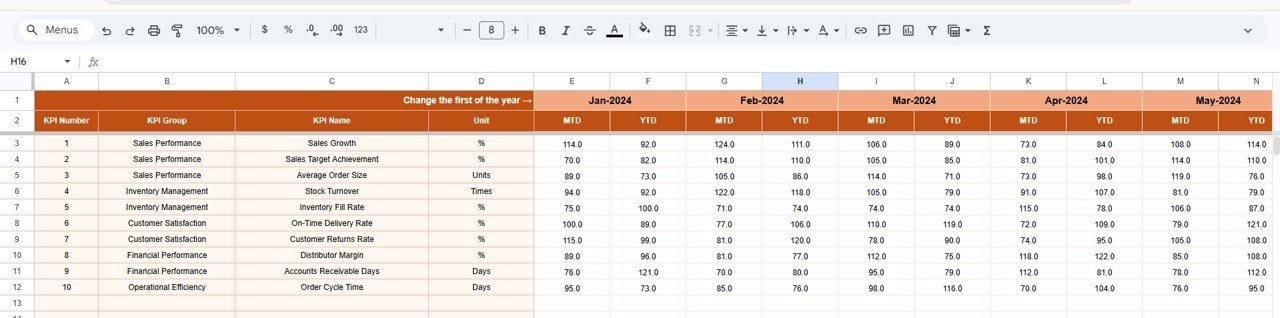
3. Actual Number Sheet Tab – Data Entry for Current Year
This sheet captures actual performance values.
Data Entry Process
-
Enter MTD and YTD actual numbers.
-
Select first month of the financial year in Range E1.
-
Dashboard calculations update automatically.
This structured input ensures accurate reporting.
Click to Buy Distributor Performance KPI Dashboard in Google Sheets
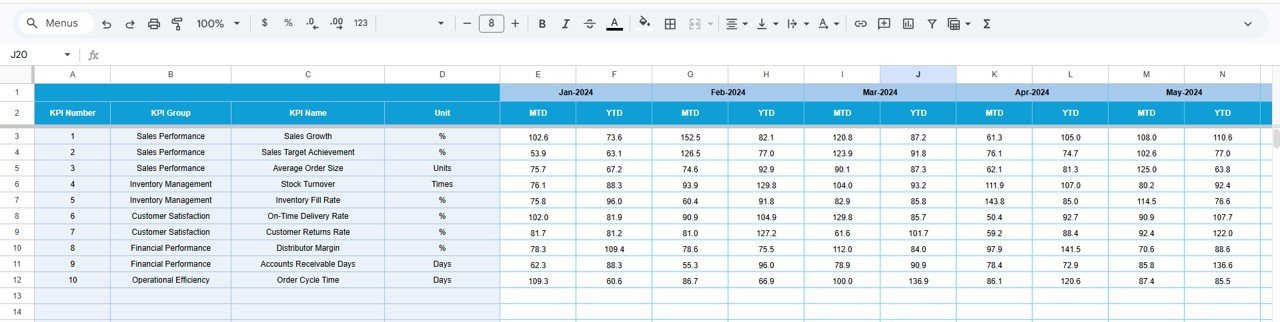
4. Target Sheet Tab – Performance Goals
This sheet stores distributor targets.
Data Captured
-
Monthly Target (MTD)
-
Year-To-Date Target (YTD)
Because targets remain centralized, performance comparison becomes consistent.
Click to Buy Distributor Performance KPI Dashboard in Google Sheets
5. Previous Year Number Sheet Tab – Historical Comparison
Here users enter previous year performance data.
Purpose
-
Compare growth trends
-
Evaluate distributor improvement
-
Measure year-over-year performance
Historical benchmarking helps organizations make strategic decisions.
Click to Buy Distributor Performance KPI Dashboard in Google Sheets
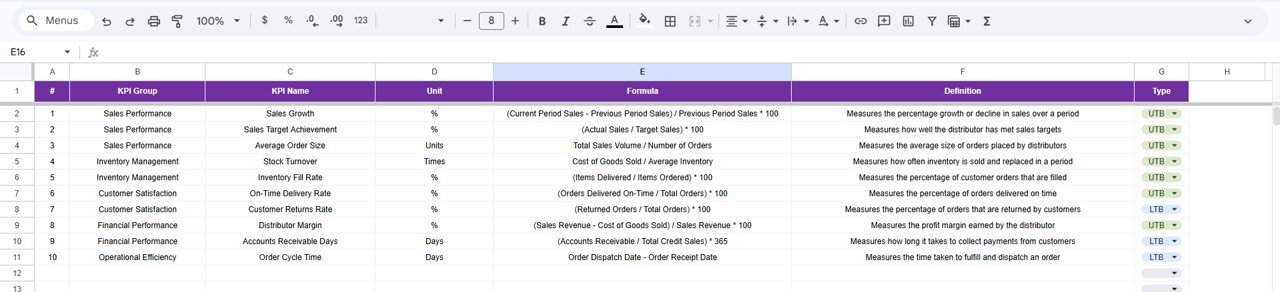
6. KPI Definition Sheet Tab – KPI Master Database
This sheet acts as the KPI reference table.
Information Maintained
- KPI Name
- KPI Group
- Unit
- Formula
- KPI Definition
Since all KPI logic remains documented, reporting stays standardized.
Click to Buy Distributor Performance KPI Dashboard in Google Sheets
Advantages of Distributor Performance KPI Dashboard in Google Sheets
Centralized Distributor Monitoring
All KPIs remain available in one dashboard.
Real-Time Performance Insights
Managers track performance instantly.
Better Decision-Making
Data visualization simplifies analysis.
Performance Accountability
Distributors remain aligned with targets.
Historical Performance Tracking
Year-over-year comparisons become easy.
Cost-Effective Solution
Google Sheets eliminates expensive software needs.
Best Practices for Distributor Performance KPI Dashboard
Click to Buy Distributor Performance KPI Dashboard in Google Sheets
To maximize dashboard effectiveness, follow these practices.
1. Define KPIs Clearly
Ensure every KPI supports business goals.
2. Maintain Data Accuracy
Validate inputs regularly.
3. Update Monthly Data Consistently
Avoid missing reporting periods.
4. Monitor Trends Frequently
Analyze KPI movements regularly.
5. Use Visual Indicators Wisely
Highlight performance gaps clearly.
6. Train Sales Teams
Ensure users understand dashboard insights.
7. Review Distributor Performance Periodically
Conduct monthly performance reviews.
Conclusion
The Distributor Performance KPI Dashboard in Google Sheets provides a structured and intelligent approach to monitoring distributor performance. Instead of relying on manual reports, organizations gain automated insights into sales achievements, growth trends, and operational efficiency.
Because the dashboard combines KPI tracking, trend analysis, and performance comparison, managers make faster decisions and improve distributor productivity. Moreover, its organized worksheet structure ensures accurate reporting and scalability.
In today’s competitive market, companies that monitor distributor performance using KPI dashboards achieve stronger growth and better operational control.
Frequently Asked Questions (FAQs)
Click to Buy Distributor Performance KPI Dashboard in Google Sheets
What is a Distributor Performance KPI Dashboard?
It is a dashboard that tracks distributor performance using measurable KPIs such as sales, delivery efficiency, and growth.
Can beginners use this dashboard?
Yes. The dashboard uses simple Google Sheets functionality and dropdown selections.
What data is required?
Actual numbers, targets, and previous year performance values.
Does the dashboard update automatically?
Yes. Selecting a month updates all calculations instantly.
Visit our YouTube channel to learn step-by-step video tutorials
Youtube.com/@NeotechNavigators
Watch the step-by-step video tutorial:
Click to Buy Distributor Performance KPI Dashboard in Google Sheets