The educational technology (EdTech) industry has witnessed significant growth and transformation, and with that, the need for efficient performance tracking. Key Performance Indicators (KPIs) play a vital role in measuring the success of EdTech initiatives, helping organizations identify areas for improvement, monitor progress, and align their strategies with their goals.
In this article, we will introduce you to the EdTech KPI Dashboard in Google Sheets, a ready-to-use template that allows you to track and visualize critical KPIs for the EdTech sector. From student performance to engagement metrics, this dashboard enables comprehensive monitoring and data-driven decision-making.
Key Features of the EdTech KPI Dashboard in Google Sheets
The EdTech KPI Dashboard template includes multiple worksheets, each designed to capture and present important data effectively. Let’s take a closer look at the key features of this template:
1. Dashboard Sheet Tab: Overview of KPIs
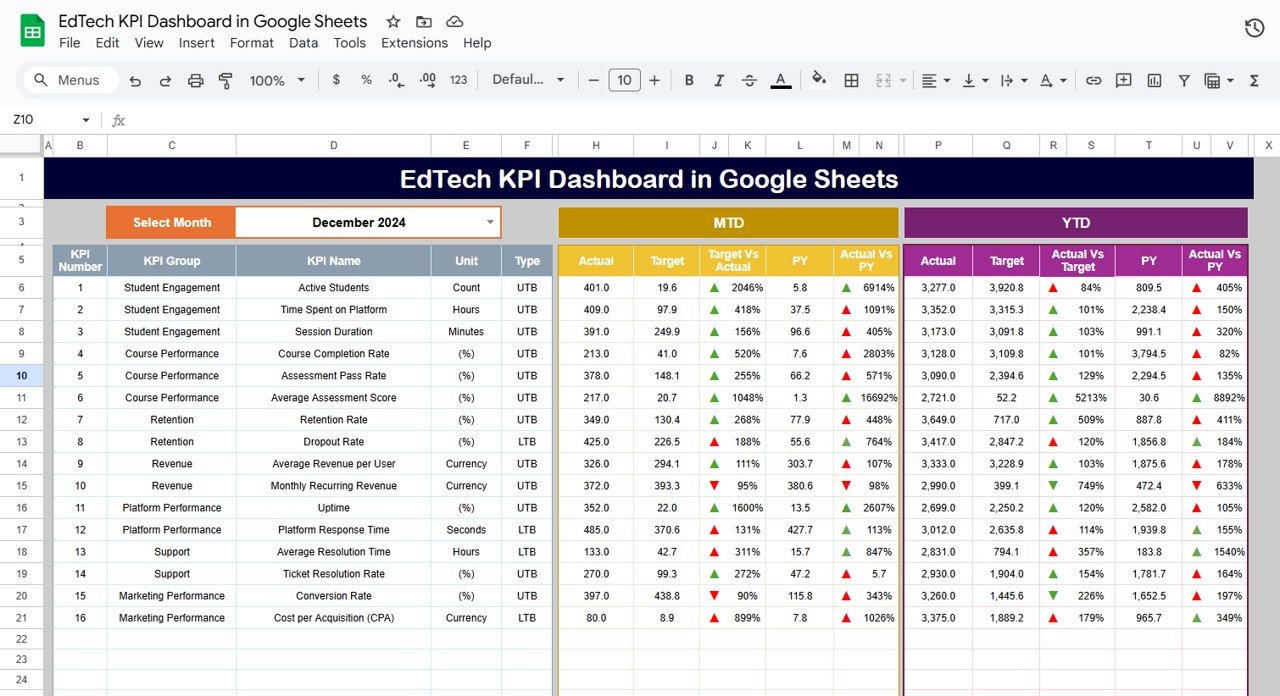
The Dashboard Sheet is the main tab where all the KPI data is displayed. This sheet offers:
-
Monthly and Year-to-Date Tracking: It shows the Month-to-Date (MTD) and Year-to-Date (YTD) actual figures, as well as the corresponding targets.
-
Comparisons: The dashboard compares Target vs Actual and Previous Year (PY) vs Actual with conditional formatting (up and down arrows) for easy visual interpretation.
-
Month Selection: You can select the desired month from a drop-down menu (cell D3), and the dashboard will automatically update all relevant metrics for that month.
Click to buy EdTech KPI Dashboard in Google Sheets
2. KPI Trend Sheet Tab: Detailed KPI Insights
The KPI Trend Sheet displays a more detailed view of each KPI, including:
-
KPI Group: The category or department to which the KPI belongs.
-
Unit: The unit of measurement for the KPI (e.g., percentage, count).
-
KPI Type: Specifies whether the KPI is “Lower the Better” or “Upper the Better”.
-
Formula: Displays the formula used to calculate the KPI.
-
Definition: A brief description of the KPI and its significance.

Click to buy EdTech KPI Dashboard in Google Sheets
3. Actual Numbers Sheet Tab: Tracking YTD and MTD
The Actual Numbers Sheet is where you input the actual performance data for each KPI. You can:
-
Enter the YTD and MTD actual numbers for each month.
-
Change the month in range E1 to adjust the data being inputted.

Click to buy EdTech KPI Dashboard in Google Sheets
4. Target Sheet Tab: Defining Goals
The Target Sheet allows you to input the target numbers for each KPI, broken down into:
-
MTD: Month-to-date target numbers.
-
YTD: Year-to-date target numbers.
This data helps you compare your actual performance with your set targets.

Click to buy EdTech KPI Dashboard in Google Sheets
5. Previous Year Numbers Sheet Tab: Historical Data
The Previous Year Numbers Sheet is where you enter last year’s data for each KPI. This enables you to compare your current year’s performance with the previous year and identify trends.

6. KPI Definition Sheet Tab: Reference for All KPIs
This sheet provides a clear reference for all KPIs used in the dashboard, including:
-
KPI Name
-
KPI Group
-
Unit
-
Formula
-
Definition
This helps you understand the logic behind each KPI and how it contributes to the overall dashboard.

Click to buy EdTech KPI Dashboard in Google Sheets
Advantages of Using the EdTech KPI Dashboard in Google Sheets
The EdTech KPI Dashboard in Google Sheets offers several significant advantages for tracking and analyzing the performance of your EdTech organization:
- Centralized Data Management: The dashboard consolidates all the data in one place, allowing you to easily track and compare KPIs for different months and years.
- Real-Time Updates: By selecting different months in the Dashboard Sheet, the data automatically updates, giving you real-time insights into your EdTech performance.
- Customization: You can easily customize the dashboard to track additional KPIs or adjust formulas to suit your specific needs.
- Easy Collaboration: Since Google Sheets is cloud-based, multiple team members can work on the dashboard simultaneously, ensuring better collaboration and shared access to the data.
Opportunities for Improvement in the EdTech KPI Dashboard
Click to buy EdTech KPI Dashboard in Google Sheets
While the EdTech KPI Dashboard is a powerful tool, there are always opportunities to enhance its functionality:
- Integration with Other Data Sources: You could integrate the dashboard with other platforms like Google Analytics or Learning Management Systems (LMS) to automate the input of data and reduce manual entry.
- Advanced Visualization: Add more advanced data visualizations, such as pie charts, heat maps, or scatter plots, to better analyze trends and performance over time.
- Dynamic Forecasting: Incorporating forecasting models that predict future performance based on historical data can help you proactively adjust strategies and meet your goals.
Best Practices for Using the EdTech KPI Dashboard
To maximize the benefits of your EdTech KPI Dashboard, here are some best practices:
1. Regularly Update the Data
Ensure that you input MTD and YTD numbers regularly to keep your dashboard up-to-date. This will provide you with accurate, real-time performance tracking.
2. Review KPIs Monthly
Perform a monthly review of the KPIs to ensure your targets are being met and to adjust strategies if necessary.
3. Encourage Team Collaboration
Allow various team members to contribute data or analyze KPIs. This can help improve insights and foster a culture of accountability.
Conclusion
The EdTech KPI Dashboard in Google Sheets is an essential tool for tracking the performance of your educational technology initiatives. With a clear structure, real-time updates, and the ability to track multiple KPIs, it empowers organizations to make data-driven decisions and optimize their strategies. By following best practices and leveraging the opportunities for improvement, you can ensure that your EdTech organization is always on track to meet its objectives.
Frequently Asked Questions with Answers
1. What KPIs are included in the EdTech KPI Dashboard?
The dashboard includes KPIs like Student Enrollment, Retention Rate, Completion Rate, Learning Engagement, and Cost per Student.
2. How do I input actual data for each KPI?
You input actual numbers in the Actual Numbers Sheet Tab, where you can select the desired month and update the YTD and MTD values.
3. Can I customize the KPIs for my specific EdTech needs?
Yes, the dashboard is fully customizable. You can add new KPIs, modify existing ones, and adjust the formulas to suit your needs.
4. How do I compare current performance with previous years?
The Dashboard Sheet compares the Actual vs Target and Actual vs Previous Year using the data from the Previous Year Numbers Sheet Tab.
5. Can I integrate the EdTech KPI Dashboard with other software?
Yes, Google Sheets allows integration with various tools through APIs, enabling automated data entry and enhanced functionality.
Visit our YouTube channel to learn step-by-step video tutorials
Youtube.com/@NeotechNavigators
Watch the step-by-step video Demo: