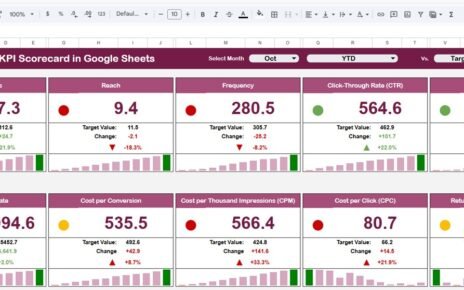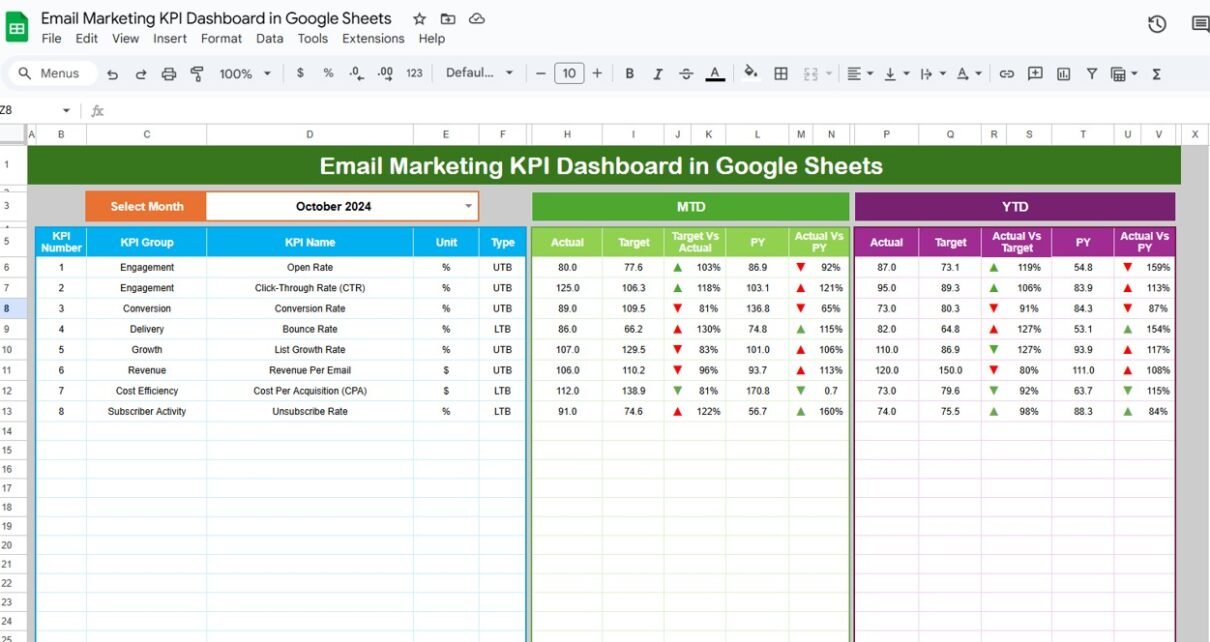
ThisEmail Marketing KPI Dashboard in Google Sheets dashboard is designed to monitor, analyze, and improve the performance of your email marketing campaigns. It provides insights at both MTD (Month-to-Date) and YTD (Year-to-Date) levels, compares performance against targets and previous year data, and provides conditional formatting to quickly visualize trends.Email Marketing KPI Dashboard in Google Sheets
The dashboard has 6 worksheets:Email Marketing KPI Dashboard in Google Sheets
-
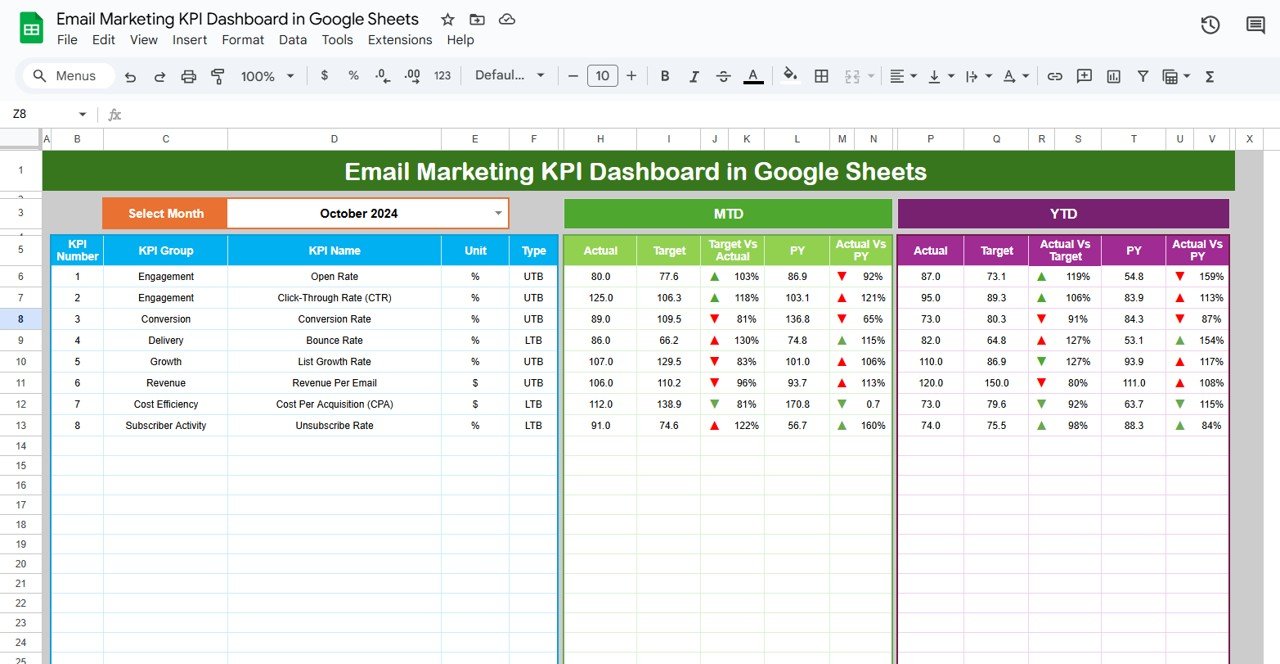
Dashboard Sheet Tab – Main visual sheet showing all KPIs with monthly selection (Range D3). Displays MTD and YTD data, Target vs Actual, PY vs Actual, with conditional up/down arrows.
-
KPI Trend Sheet Tab – Shows KPI trends over time. Users can select a KPI (C3) to view its group, unit, type, formula, and definition, including whether lower or upper values are better.
-
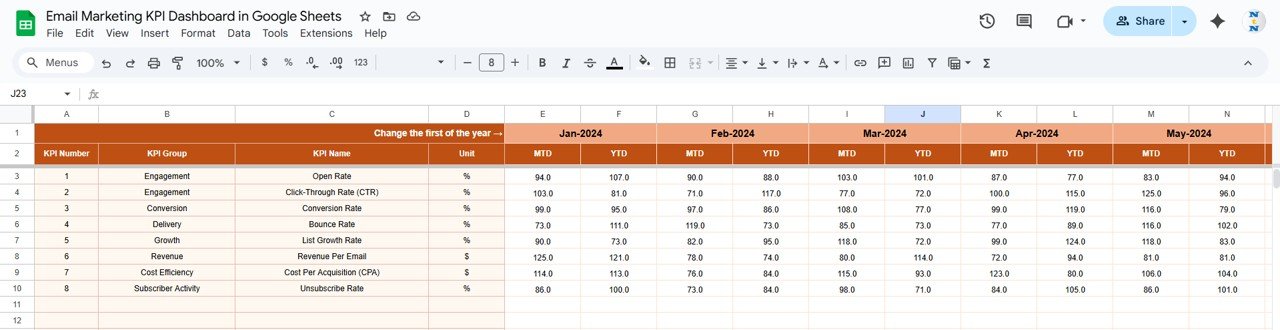
Actual Number Sheet Tab – Input actual numbers for each KPI (MTD & YTD). Select month in Range E1 to update.
-
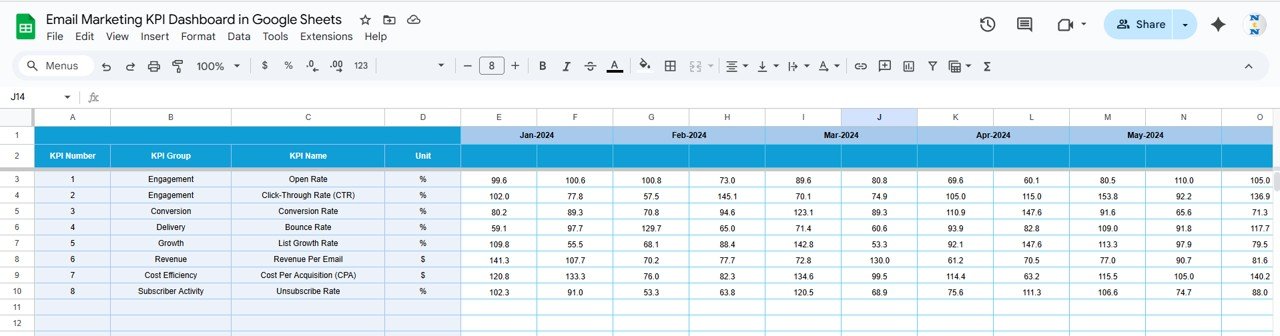
Target Sheet Tab – Input target numbers for each KPI for the month (MTD & YTD).
-
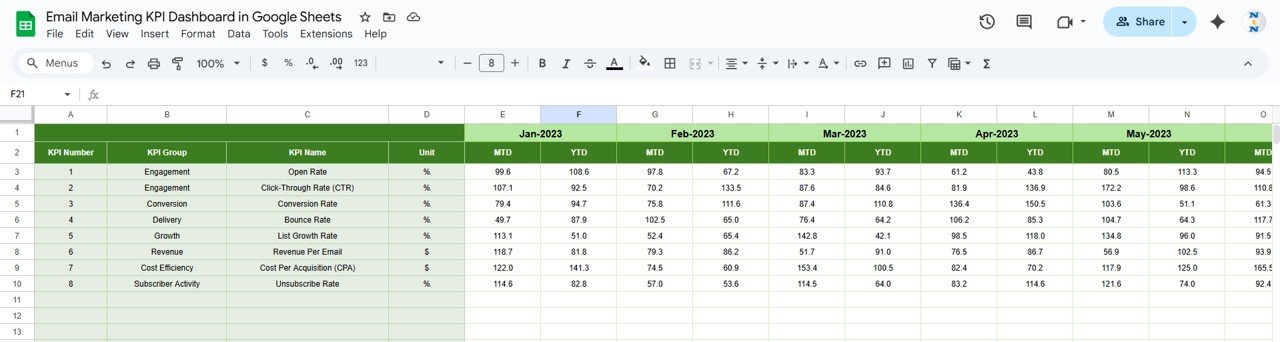
Previous Year Number Sheet Tab – Input previous year data for comparison.
-
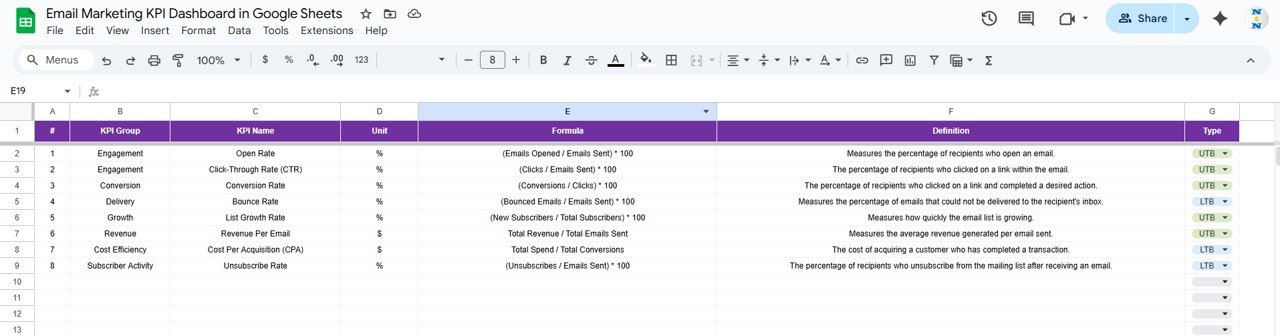
KPI Definition Sheet Tab – Maintain KPI metadata: Name, Group, Unit, Formula, Definition.Email Marketing KPI Dashboard in Google Sheets
Dashboard Functionality Email Marketing KPI Dashboard in Google Sheets
1. Dashboard Sheet
-
Main visualization tab
-
Month selection: Range D3
-
Shows MTD & YTD Actual, Target, Previous Year
-
Conditional formatting with up/down arrows for Target vs Actual and PY vs Actual
Click to Buy Email Marketing KPI Dashboard in Google Sheets
2. KPI Trend Sheet
-
Select KPI (Range C3)
Displays:
- KPI Group
- Unit
- Type (Lower the better / Upper the better)
- Formula
- Definition
Trend chart shows KPI performance over time

Click to Buy Email Marketing KPI Dashboard in Google Sheets
3. Actual Number Sheet
-
Input actual numbers for each KPI
-
Select month in Range E1
-
Dashboard updates automatically
4. Target Sheet
-
Input monthly target numbers (MTD & YTD)
-
Helps compare performance against expectations
Click to Buy Email Marketing KPI Dashboard in Google Sheets
5. Previous Year Number Sheet
-
Input last year’s data
-
Allows year-over-year comparison
6. KPI Definition Sheet
-
Maintain a central repository of KPI information
Includes:
- KPI Name
- KPI Group
- Unit
- Formula
- Definition
Click to Buy Email Marketing KPI Dashboard in Google Sheets
Advantages of Using This Email Marketing KPI Dashboard
-
Centralized Metrics – Track all KPIs in one sheet.
-
Real-Time Analysis – Select month to instantly update dashboard.
-
Data-Driven Decisions – Compare MTD, YTD, and PY data with targets.
-
Conditional Formatting – Quickly identify areas of improvement.
-
KPI Trend Monitoring – Track trends and optimize campaigns.
-
Lower/Upper Better Insights – Know which metrics to maximize or minimize.
-
Flexible & Collaborative – Built in Google Sheets, accessible anytime, anywhere.
Opportunities for Improvement in the Dashboard
Click to Buy Email Marketing KPI Dashboard in Google Sheets
-
Automate Data Import – Pull email platform metrics directly using API.
-
Add Predictive KPIs – Forecast opens, clicks, and conversions for the upcoming month.
-
Segment Analysis – Track KPIs per segment (location, behavior, demographic).
-
Integrate Revenue Impact – Link email performance to sales or ROI.
-
Visual Enhancements – Add dynamic charts, sparkline trends, or conditional color scales.
Best Practices for Email Marketing KPI Tracking
-
Update KPIs Monthly – Keep actual, target, and previous year numbers up to date.
-
Define KPI Formulas Clearly – Avoid miscalculations; maintain in KPI Definition sheet.
-
Monitor Both MTD & YTD – Understand short-term and long-term trends.
-
Focus on Upper/Lower Better Metrics – Target improvement areas accordingly.
-
Share Dashboard With Teams – Marketing, Sales, and Analytics teams should access it.
-
Use Conditional Formatting Smartly – Highlight underperformance or overperformance.
-
Audit Data Regularly – Ensure accuracy of entered metrics to maintain reliability.
Frequently Asked Questions (FAQs)
Click to Buy Email Marketing KPI Dashboard in Google Sheets
1. What is an Email Marketing KPI Dashboard?
It is a Google Sheets dashboard that tracks performance of email campaigns through key metrics such as open rate, click rate, conversions, and revenue per email.
2. Why use Google Sheets for email KPIs?
Google Sheets is cloud-based, flexible, easy to share, and allows real-time collaboration.
3. Can I track monthly and yearly performance?
Yes, the dashboard supports MTD (Month-to-Date) and YTD (Year-to-Date) metrics, with comparison against targets and previous year data.
4. How do I know which KPIs to improve?
Refer to the KPI type column – metrics marked Lower the Better should decrease, while Upper the Better should increase.
5. Can I add custom KPIs?
Yes, new KPIs can be added in the KPI Definition sheet and linked to the actual, target, and previous year sheets.
6. Does the dashboard show trends?
Yes, the KPI Trend sheet provides visual trends for selected KPIs over time.
7. How often should I update the actual numbers?
Ideally, update monthly or after each campaign to maintain accuracy.
Visit our YouTube channel to learn step-by-step video tutorials
Youtube.com/@NeotechNavigators
Watch the step-by-step video Demo: