Maintaining a safe and healthy workplace is crucial for employee well-being and organizational compliance. The Employee Health and Safety Dashboard in Google Sheets provides a ready-to-use solution for tracking workplace incidents, analyzing safety trends, and monitoring preventive measures.
In this article, we will explain the key features, benefits, and best practices for using this dashboard.
What Is an Employee Health and Safety Dashboard?
An Employee Health and Safety Dashboard is a visual tool that consolidates incident data, enabling HR and safety managers to monitor workplace safety metrics. By using Google Sheets, this dashboard is accessible, collaborative, and easy to maintain, providing real-time insights into safety performance across your organization.
With this dashboard, you can:
-
Track total incidents, severity, and open vs. resolved cases
-
Monitor preventive actions and medical attention requirements
-
Analyze trends by department, incident type, and region
-
Improve decision-making to enhance workplace safety
Key Features of the Employee Health and Safety Dashboard
Click to Buy Employee Health and Safety Dashboard in Google Sheets
This dashboard consists of two main sheet tabs:
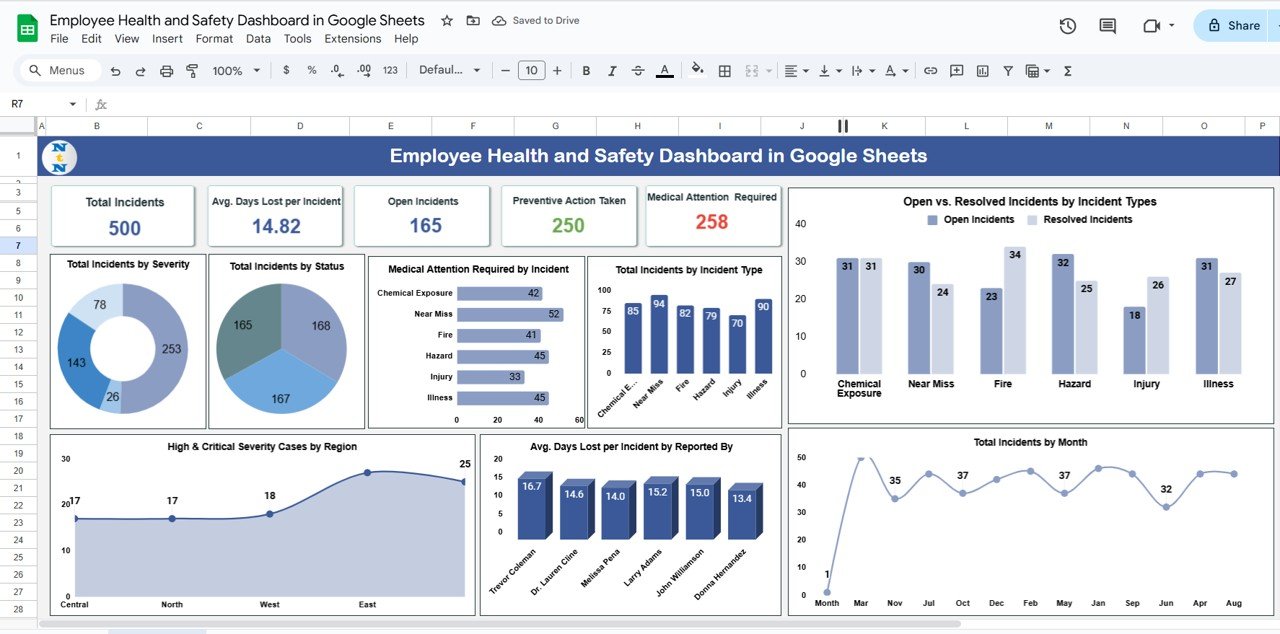
1. Dashboard Sheet Tab
The Dashboard sheet provides an overview of safety metrics using cards and charts.
Cards:
-
Total Incidents: Number of incidents reported
-
Avg. Days Lost per Incident: Average downtime per incident
-
Open Incidents: Current unresolved cases
-
Preventive Action Taken: Number of preventive measures implemented
-
Medical Attention Required: Number of incidents needing medical attention
Charts:
-
Total Incidents by Severity Level: Tracks low, medium, high, and critical incidents
-
Total Incidents by Status: Visualizes open, resolved, and in-progress cases
-
Medical Attention Required by Incident: Shows cases requiring medical intervention
-
Total Incidents by Incident Type: Breaks down incidents by type (e.g., slip, fall, machinery)
-
Open vs. Resolved Incidents by Incident Type: Compare unresolved vs resolved cases by category
-
Total Incidents by Month: Monthly trend of incidents
-
Avg. Days Lost per Incident by Reported By: Highlights departments or employees with higher downtime
-
High & Critical Severity Cases by Region: Regional breakdown of severe incidents4
Click to Buy Employee Health and Safety Dashboard in Google Sheets
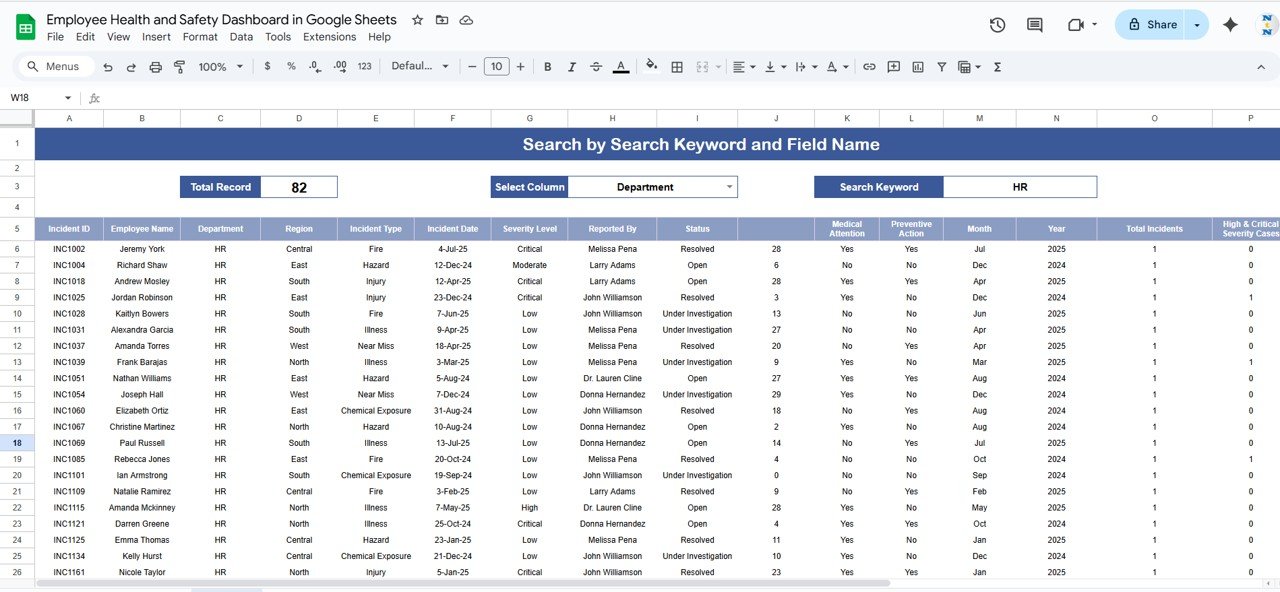
Search Function:
-
Allows searching by keywords or field names for quick access to incident data
Click to Buy Employee Health and Safety Dashboard in Google Sheets
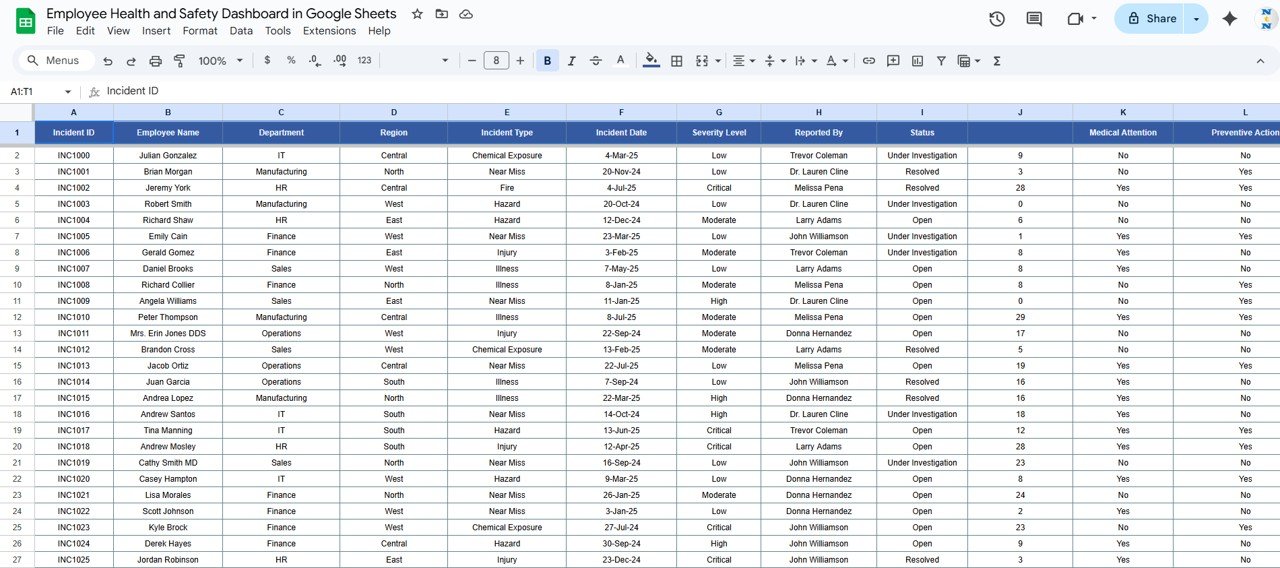
2. Data Sheet Tab
The Data Sheet acts as the input sheet where all incidents are recorded.
-
Each record includes details such as date, severity, status, incident type, location, preventive action, and medical attention required
-
Updating the data sheet automatically reflects changes in the Dashboard sheet
This structured approach ensures accurate reporting and easy trend analysis.
Advantages of Using the Employee Health and Safety Dashboard
Click to Buy Employee Health and Safety Dashboard in Google Sheets
-
Centralized Data: Consolidates all incident data in one place
-
Real-Time Insights: Updates instantly when new incidents are recorded
-
Trend Analysis: Identify patterns by month, department, or incident type
-
Preventive Action Tracking: Monitor whether corrective actions are being implemented
-
Improved Safety Management: Helps HR and safety teams take proactive measures
-
Customizable: Easily adjust metrics, severity levels, and categories to fit your organization
Best Practices for Using the Dashboard
-
Update Incident Data Promptly: Record incidents immediately to ensure accurate reporting
-
Segment Data Effectively: Analyze by department, location, or incident type to identify high-risk areas
-
Monitor Preventive Actions: Track the implementation and effectiveness of safety measures
-
Review Severity Trends: Focus on reducing high and critical incidents
-
Use Visual Analytics: Leverage charts and cards to communicate trends to management
-
Conduct Regular Safety Reviews: Use the dashboard insights to plan safety trainings and improvements
How This Dashboard Helps Organizations
Click to Buy Employee Health and Safety Dashboard in Google Sheets
-
Enhance Workplace Safety: Identify and mitigate risks proactively
-
Improve Compliance: Maintain records for OSHA or regulatory reporting
-
Support Employee Well-Being: Track incidents that impact health and productivity
-
Allocate Resources Efficiently: Direct safety resources to high-risk departments or regions
-
Measure Safety Program Effectiveness: Evaluate the impact of training and preventive actions
Frequently Asked Questions (FAQs)
Click to Buy Employee Health and Safety Dashboard in Google Sheets
Q1: Can I customize the dashboard for my organization?
Yes, you can modify severity levels, incident types, and reporting fields to match your company’s safety policies.
Q2: How often should incident data be updated?
It’s best to update the data as soon as incidents occur. Regular weekly reviews can also help track trends.
Q3: Can I analyze incidents by department or region?
Yes, charts like Avg. Days Lost per Incident by Reported By and High & Critical Severity Cases by Region provide detailed insights.
Q4: Does this dashboard track preventive actions?
Yes, it includes a metric for preventive actions taken to monitor safety measures.
Q5: Is this dashboard suitable for large organizations?
Absolutely. Google Sheets supports large datasets and real-time collaboration among multiple HR or safety team members.
Conclusion
The Employee Health and Safety Dashboard in Google Sheets is an essential tool for organizations aiming to monitor incidents, improve safety, and protect employee well-being. By consolidating data into visual cards and charts, it enables HR and safety teams to make informed, proactive decisions and maintain a safer workplace.
Visit our YouTube channel to learn step-by-step video tutorials
Youtube.com/@NeotechNavigators
Watch the step-by-step video Demo:
Click to Buy Employee Health and Safety Dashboard in Google Sheets