Employee satisfaction is a critical factor in driving productivity, retention, and overall company performance. The Employee Satisfaction Dashboard in Google Sheets provides a ready-to-use solution for HR teams and managers to track satisfaction metrics, identify areas of improvement, and make data-driven decisions.
In this article, we will explore the key features, advantages, and best practices of using this dashboard.
What Is an Employee Satisfaction Dashboard?
An Employee Satisfaction is a visual tool that consolidates employee survey data to measure engagement and satisfaction across various parameters. It provides insights into work environment, management, compensation, work-life balance, and growth opportunities.
With Google Sheets, this dashboard becomes highly accessible and collaborative, allowing HR teams to update data in real-time and monitor trends across departments, locations, and job roles.
Key Features of the Employee Satisfaction Dashboard
Click to Buy Employee Satisfaction Dashboard in Google Sheets
This dashboard is designed with two main sheets:
1. Dashboard Sheet Tab
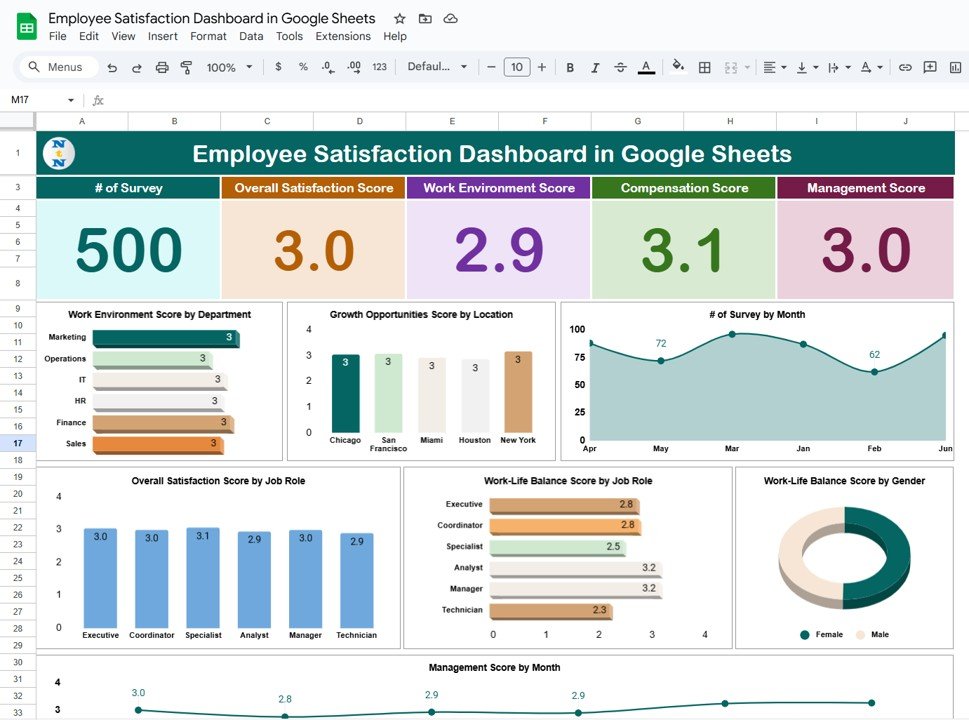
The Dashboard sheet provides an overview of all satisfaction metrics using cards and charts.
Cards Section:
-
# of Surveys: Total number of completed employee surveys
-
Overall Satisfaction Score: Aggregate satisfaction across all employees
-
Work Environment Score: Average score for work environment metrics
-
Compensation Score: Average employee rating for compensation
-
Management Score: Average score reflecting management effectiveness
Charts Section:
-
Work Environment Score by Department: Visualizes satisfaction across departments
-
Growth Opportunities Score by Location: Compares perceived growth opportunities across office locations
-
# of Surveys by Month: Tracks survey participation trends over time
-
Overall Satisfaction Score by Job Role: Measures satisfaction levels by job position
-
Work-Life Balance Score by Job Role: Evaluates balance by role within the organization
-
Work-Life Balance Score by Gender: Identifies gender-based differences in work-life balance satisfaction
-
Management Score by Month: Tracks management performance trends over time
Click to Buy Employee Satisfaction Dashboard in Google Sheets
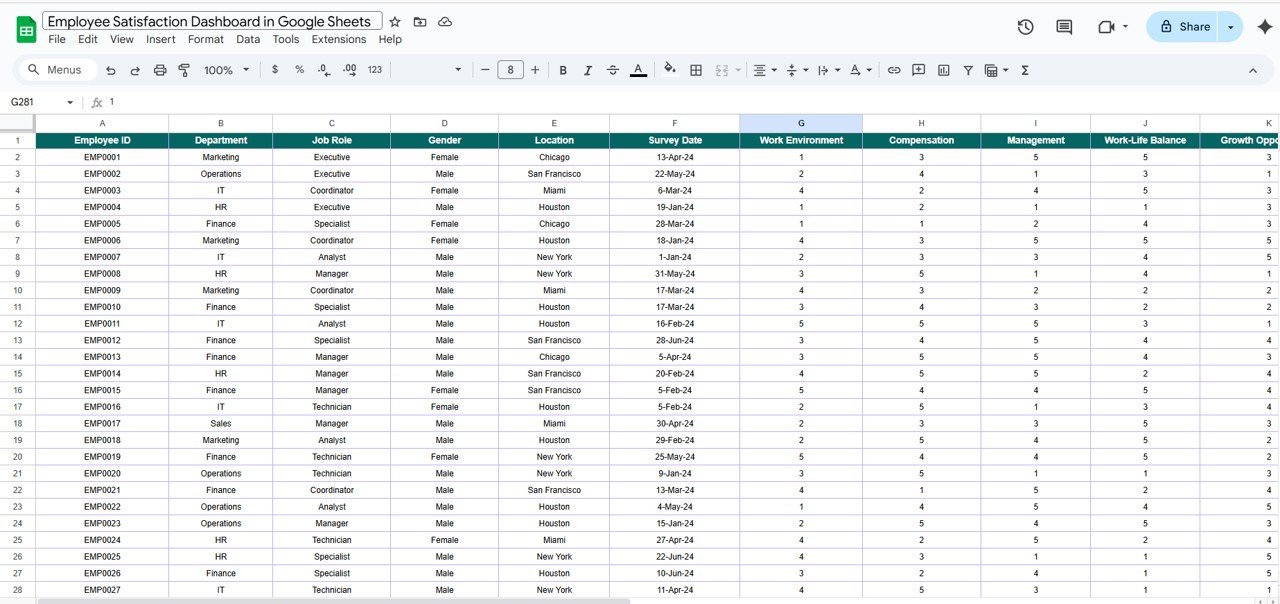
2. Data Sheet Tab
The Data sheet serves as the input sheet where all survey responses are recorded.
-
Each survey captures scores for overall satisfaction, work environment, compensation, management, work-life balance, and growth opportunities.
-
Data can be segmented by department, location, job role, and gender for detailed insights.
-
Updating this sheet automatically reflects changes on the Dashboard sheet, ensuring real-time tracking and analysis.
Click to Buy Employee Satisfaction Dashboard in Google Sheets
Advantages of Using the Employee Satisfaction Dashboard
-
Centralized Tracking: All employee satisfaction metrics in one location
-
Real-Time Insights: Instant updates when new survey data is entered
-
Visual Analysis: Charts and cards simplify trend analysis and decision-making
-
Identify Gaps: Quickly pinpoint departments, locations, or roles with low satisfaction
-
Employee Engagement: Helps HR take action to improve engagement and retention
-
Customizable: Easily adjust metrics, scores, or categories to fit your organization
Best Practices for Using the Dashboard
Click to Buy Employee Satisfaction Dashboard in Google Sheets
-
Regularly Update Survey Data: Input survey results promptly to keep the dashboard accurate
-
Segment Data Effectively: Use departments, job roles, locations, and gender for detailed insights
-
Track Trends Over Time: Analyze monthly changes in satisfaction scores to identify improvements or declines
-
Prioritize Actionable Insights: Focus on areas with low scores such as management or work-life balance
-
Communicate Findings: Share dashboard insights with leadership and employees to drive engagement initiatives
How This Dashboard Helps HR Teams
-
Monitor Employee Engagement: Track key satisfaction metrics across the organization
-
Identify Strengths and Weaknesses: Use department and location-based charts to spot trends
-
Support Strategic Decisions: Plan initiatives to improve compensation, management, or work-life balance
-
Increase Retention: Improve workplace satisfaction to reduce employee turnover
-
Measure Impact of Policies: Evaluate how changes in management or benefits affect satisfaction
Frequently Asked Questions (FAQs)
Click to Buy Employee Satisfaction Dashboard in Google Sheets
Q1: Can I add more metrics to this dashboard?
Yes, the dashboard is fully customizable. You can add additional scores or KPIs to track other aspects of employee engagement.
Q2: How often should survey data be updated?
Update the data whenever new surveys are collected. Monthly updates are ideal for tracking trends.
Q3: Can I analyze data by gender or job role?
Yes, the dashboard includes charts for Work-Life Balance Score by Gender and Overall Satisfaction Score by Job Role.
Q4: Is this dashboard suitable for large organizations?
Absolutely. Google Sheets supports collaborative editing and can handle a large volume of survey data.
Q5: Can this dashboard track trends over time?
Yes, charts like Management Score by Month and # of Surveys by Month help track trends over time.
Conclusion
Click to Buy Employee Satisfaction Dashboard in Google Sheets
The Employee Satisfaction Dashboard in Google Sheets provides a comprehensive, visual, and easy-to-use solution for tracking employee engagement. By consolidating survey data into cards and charts, HR teams can identify problem areas, monitor improvements, and implement targeted strategies to boost workplace satisfaction.
Visit our YouTube channel to learn step-by-step video tutorials
Youtube.com/@NeotechNavigators
Click to Buy Employee Satisfaction Dashboard in Google Sheets