Employee training plays a vital role in improving productivity, closing skill gaps, and supporting long-term business growth. However, when training data stays scattered across emails, LMS reports, and spreadsheets, HR teams struggle to measure effectiveness and justify training investments. As a result, training decisions become reactive instead of strategic.Employee Training KPI Dashboard in Google Sheets
That is exactly why an Employee Training KPI Dashboard in Google Sheets becomes a powerful workforce analytics tool.
This ready-to-use dashboard transforms training data into clear KPIs, performance trends, and meaningful comparisons. It helps HR leaders, learning teams, and managers track training participation, cost efficiency, completion rates, and learning outcomes using a single, easy-to-manage dashboard.Employee Training KPI Dashboard in Google Sheets
In this article, you will learn what this dashboard is, how it works, which KPIs it includes, how each worksheet functions, its advantages, improvement opportunities, best practices, and frequently asked questions.Employee Training KPI Dashboard in Google Sheets
What Is an Employee Training KPI Dashboard in Google Sheets?
Click to Buy Employee Training KPI Dashboard in Google Sheets
An Employee Training KPI Dashboard is a performance tracking system designed to monitor training effectiveness across an organization. It measures training participation, completion, cost, learning impact, and performance improvement.
Because this dashboard is built in Google Sheets, it offers:
-
Real-time collaboration
-
Automatic KPI calculations
-
Month-to-Date (MTD) and Year-to-Date (YTD) tracking
-
Target vs Actual analysis
-
Previous-year comparison
-
Visual indicators for quick insights
As a result, HR teams gain full visibility into training performance without complex BI tools.
Key Features of the Employee Training KPI Dashboard
This dashboard is structured with 6 well-organized worksheets, each serving a specific analytical purpose.
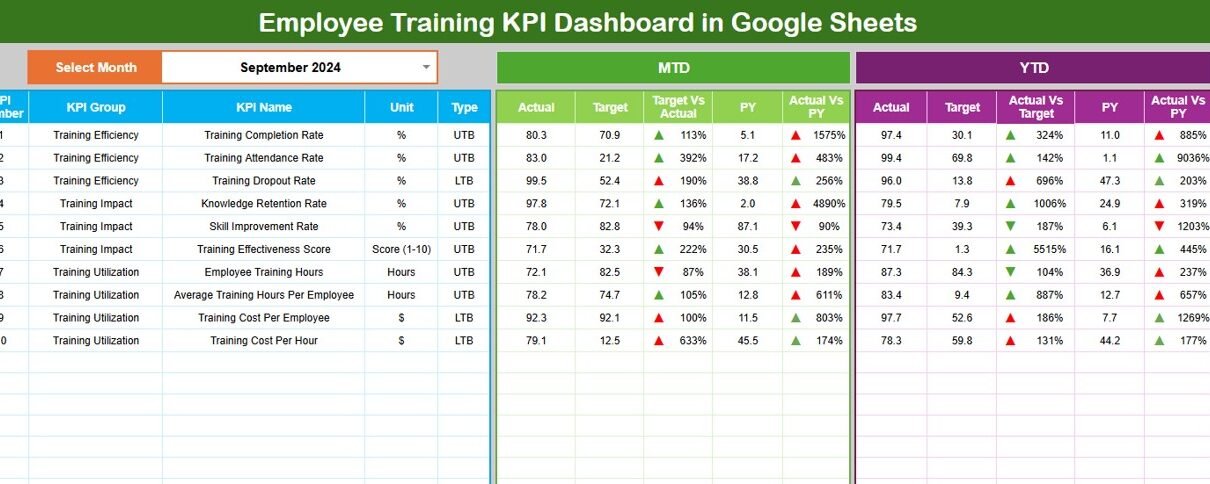
1. Dashboard Sheet Tab (Main Dashboard)
The Dashboard Sheet acts as the executive summary.
Month Selection
-
Use the dropdown in cell D3 to select the month.
-
All KPI values update automatically based on the selected month.
MTD Performance Section
-
MTD Actual
-
MTD Target
-
MTD Previous Year
-
Target vs Actual
-
Previous Year vs Actual
YTD Performance Section
-
YTD Actual
-
YTD Target
-
YTD Previous Year
-
Target vs Actual
-
Previous Year vs Actual
Conditional formatting with up and down arrows highlights performance trends instantly:
-
Green arrow → positive improvement
-
Red arrow → decline
This sheet helps leadership review training performance at a glance.

Click to Buy Employee Training KPI Dashboard in Google Sheets
2. KPI Trend Sheet Tab
The KPI Trend Sheet allows deep analysis of individual training KPIs.
How It Works
Select a KPI from the dropdown in cell C3
The sheet displays:
- KPI Group
- KPI Unit
- KPI Type (Upper the Better / Lower the Better)
- KPI Formula
- KPI Definition
Trend charts show month-wise movement, making training gaps easy to identify.

Click to Buy Employee Training KPI Dashboard in Google Sheets
3. Actual Number Sheet Tab
This sheet captures actual training performance values.
Key Details
-
Enter MTD and YTD actual values
-
Select the first month of the year in cell E1
-
All KPIs recalculate automatically
This ensures consistency and accurate reporting throughout the year.

Click to Buy Employee Training KPI Dashboard in Google Sheets
4. Target Sheet Tab
The Target Sheet defines training goals.
Why Targets Matter
-
Set clear training expectations
-
Align training with business strategy
-
Measure success objectively
Targets can change monthly or annually based on learning priorities.

5. Previous Year Number Sheet Tab
This sheet stores last year’s training performance data.
Benefits
-
Year-over-year training comparison
-
Skill development trend analysis
-
ROI evaluation over time
Historical insights strengthen future training plans.

Click to Buy Employee Training KPI Dashboard in Google Sheets
6. KPI Definition Sheet Tab
This sheet acts as the single source of truth.
It includes:
-
KPI Name
-
KPI Group
-
Unit
-
Formula
-
KPI Definition
-
KPI Type (Upper / Lower the Better)
It ensures consistency and clarity across teams.

Click to Buy Employee Training KPI Dashboard in Google Sheets
Advantages of Employee Training KPI Dashboard
-
Centralized training performance tracking
-
Clear visibility into training effectiveness
-
Better learning investment decisions
-
Improved employee skill development
-
Faster reporting and reviews
-
Easy collaboration using Google Sheets
Opportunities for Improvement
Click to Buy Employee Training KPI Dashboard in Google Sheets
Organizations can enhance this dashboard by:
-
Adding department-wise training analysis
-
Tracking trainer performance
-
Linking training outcomes to employee performance
-
Integrating LMS data automatically
-
Adding competency gap analysis
Best Practices for Using the Training KPI Dashboard
-
Update training data regularly
-
Review KPIs monthly and quarterly
-
Set realistic training targets
-
Analyze low completion or satisfaction scores
-
Align training KPIs with business goals
-
Share insights with leadership
Conclusion
Click to Buy Employee Training KPI Dashboard in Google Sheets
An Employee Training KPI Dashboard in Google Sheets provides a structured and reliable way to measure training impact. It replaces guesswork with data-driven insights, helping organizations build skilled, engaged, and future-ready teams.
Because the dashboard is flexible, collaborative, and easy to use, it fits organizations of all sizes. With disciplined usage and the right KPIs, training programs deliver measurable value.
Frequently Asked Questions (FAQs)
1. Who should use this dashboard?
HR teams, L&D managers, training coordinators, and leadership.
2. Can this dashboard track different training types?
Yes, it supports technical, soft skills, compliance, and certification training.
3. Does it support MTD and YTD tracking?
Yes, both views are fully built in.
4. Can KPIs be customized?
Yes, the KPI Definition sheet allows full customization.
5. Is Google Sheets secure for training data?
Yes, with proper access permissions.
Visit our YouTube channel to learn step-by-step video tutorials
Youtube.com/@NeotechNavigators
Watch the step-by-step video tutorial:
Click to Buy Employee Training KPI Dashboard in Google Sheets