Managing employee workload plays a vital role in productivity, employee well-being, and timely project delivery. When teams face uneven task distribution, some employees experience burnout while others remain underutilized. However, many organizations still rely on manual tracking, emails, or basic spreadsheets, which makes workload monitoring difficult and inefficient.
That is exactly why an Employee Workload Dashboard in Google Sheets becomes an essential workforce management tool.
This ready-to-use dashboard helps organizations track task status, estimated effort, and workload distribution across employees, departments, categories, and months. Moreover, it provides visual insights and a powerful search feature that supports faster and smarter decisions.
In this article, you will learn what this dashboard is, how it works, its advantages, improvement opportunities, best practices, and frequently asked questions.
What Is an Employee Workload Dashboard in Google Sheets?
An Employee Workload Dashboard in Google Sheets is a centralized reporting tool designed to monitor how tasks and effort are distributed across employees and teams.
Instead of manually reviewing task lists, this dashboard allows managers to:
-
Track total, completed, in-progress, and not-started tasks
-
Analyze estimated work hours
-
Balance workload across employees and departments
-
Identify bottlenecks and capacity issues
-
Improve task planning and delivery
Because the dashboard runs in Google Sheets, teams can collaborate in real time without additional software.
Why Is Employee Workload Tracking Important?
Click to Buy Employee Workload Dashboard in Google Sheets
Unbalanced workloads reduce productivity and employee satisfaction. Therefore, proper workload tracking helps organizations:
-
Prevent employee burnout
-
Improve task prioritization
-
Increase on-time task completion
-
Optimize resource utilization
-
Support fair workload distribution
As a result, teams work more efficiently and sustainably.
Key Features of the Employee Workload Dashboard
This dashboard is designed to be simple, visual, and scalable.
Key Highlights
-
Ready-to-use Google Sheets dashboard
-
KPI cards for quick insights
-
Employee, department, and category analysis
-
Monthly workload trends
-
Smart search by keyword and field name
-
Easy customization
Overview Sheet Tab
Click to Buy Employee Workload Dashboard in Google Sheets
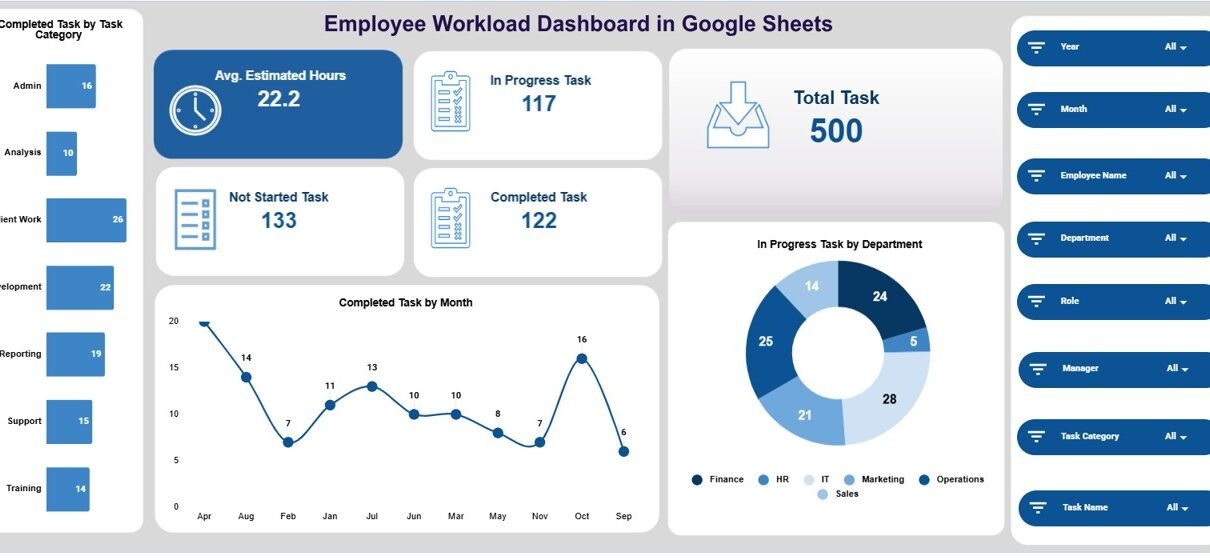
The Overview Sheet provides a high-level snapshot of workload status.
KPI Cards
The dashboard displays the following cards:
-
Avg. Estimated Hours – Average planned effort per task
-
In Progress Task – Number of ongoing tasks
-
Total Task – Total tasks recorded
-
Completed Task – Successfully completed tasks
-
Not Started Task – Tasks yet to begin
These cards help managers instantly understand workload pressure.
Overview Charts
Completed Task by Task Category
Shows how task completion varies across different task categories.
Completed Task by Month
Tracks monthly task completion trends to evaluate productivity over time.
In Progress Task by Department
Highlights departments carrying higher active workload.

Click to Buy Employee Workload Dashboard in Google Sheets
Employee Analysis
This section focuses on individual employee workload and performance.
Charts Included
-
Completed Task by Employee Name
-
In Progress Task by Employee Name
-
Not Started Task by Employee Name
-
Avg. Estimated Hours by Employee Name
These charts help managers identify overloaded or underutilized employees.

Click to Buy Employee Workload Dashboard in Google Sheets
Department Analysis
This section analyzes workload distribution at the department level.
Charts Included
-
Completed Task by Department
-
In Progress Task by Department
-
Not Started Task by Department
-
Avg. Estimated Hours by Department
As a result, leadership can balance work across teams more effectively.

Click to Buy Employee Workload Dashboard in Google Sheets
Category Analysis
Different task categories demand different effort levels. This section helps evaluate category-wise workload.
Charts Included
-
Completed Task by Category
-
In Progress Task by Category
-
Not Started Task by Category
-
Avg. Estimated Hours by Category
These insights support better planning and prioritization.

Click to Buy Employee Workload Dashboard in Google Sheets
Monthly Trends
The Monthly Trends section shows how workload changes over time.
Charts Included
-
Completed Task by Month
-
In Progress Task by Month
-
Not Started Task by Month
-
Avg. Estimated Hours by Month
This view helps teams track productivity patterns and seasonal workload spikes.

Click to Buy Employee Workload Dashboard in Google Sheets
Search Functionality – Search by Keyword and Field Name
The dashboard includes a powerful Search feature that allows users to filter tasks instantly.
Users can search by:
-
Employee name
-
Department
-
Task category
-
Task status
-
Month
This feature saves time and improves operational efficiency.

Click to Buy Employee Workload Dashboard in Google Sheets
Advantages of Using Employee Workload Dashboard in Google Sheets
-
Centralized workload visibility
-
Improved task planning and allocation
-
Reduced employee burnout
-
Faster decision-making
-
Real-time collaboration
-
Easy customization
-
No additional software cost
Opportunities for Improvement
Organizations can enhance this dashboard by:
-
Adding workload capacity thresholds
-
Integrating task priority scoring
-
Linking deadlines and SLA tracking
-
Automating task input using Google Forms
-
Adding forecast vs actual workload analysis
Best Practices for Using the Employee Workload Dashboard
Click to Buy Employee Workload Dashboard in Google Sheets
-
Update task data regularly
-
Review workload weekly
-
Reassign tasks proactively
-
Monitor estimated vs actual hours
-
Share insights with team leaders
-
Use trends for long-term planning
Conclusion
An Employee Workload Dashboard in Google Sheets provides a clear and structured way to monitor task distribution, effort levels, and productivity. It replaces guesswork with data-driven insights and helps organizations balance workloads effectively.
Because the dashboard is flexible, collaborative, and scalable, it becomes a valuable tool for teams of all sizes.
Frequently Asked Questions (FAQs)
1. Who should use this dashboard?
Team leaders, project managers, HR teams, and operations managers.
2. Can I customize task categories and statuses?
Yes, all fields and categories are fully customizable.
3. Does the dashboard support multiple departments?
Yes, it supports department-wise and employee-wise analysis.
4. Is Google Sheets secure for workload data?
Yes, with proper sharing and access controls.
5. Can this dashboard scale for large organizations?
Yes, it works for small teams and enterprise-level organizations.
Visit our YouTube channel to learn step-by-step video tutorials
Youtube.com/@NeotechNavigators
Watch the step-by-step video tutorial: