Managing enterprise assets—whether IT equipment, machinery, office infrastructure, or operational tools—is essential for long-term cost control, operational efficiency, and financial planning. Without a structured system, organizations struggle to track asset status, depreciation, warranty cycles, vendor details, and departmental allocation.Enterprise Asset Monitoring Dashboard in Google Sheets
The Enterprise Asset Monitoring Dashboard in Google Sheets solves this challenge with a ready-to-use, data-driven, and interactive monitoring system. It provides complete visibility into asset performance, asset value, and lifecycle stages, all through automated charts and intuitive KPI summaries.Enterprise Asset Monitoring Dashboard in Google Sheets
In this detailed article, we explain every component of this dashboard — including its features, analysis sections, opportunities for improvement, best practices, and FAQs.Enterprise Asset Monitoring Dashboard in Google Sheets
What Is an Enterprise Asset Monitoring Dashboard in Google Sheets?
An Enterprise Asset Monitoring Dashboard is a structured tool built in Google Sheets to help organizations track and analyze their assets effectively. It allows you to monitor:
Because it is built in Google Sheets, it is cloud-based, collaborative, customizable, and cost-free — making it ideal for businesses of all sizes.
Overview Sheet Tab
Click to Buy Enterprise Asset Monitoring Dashboard in Google Sheets
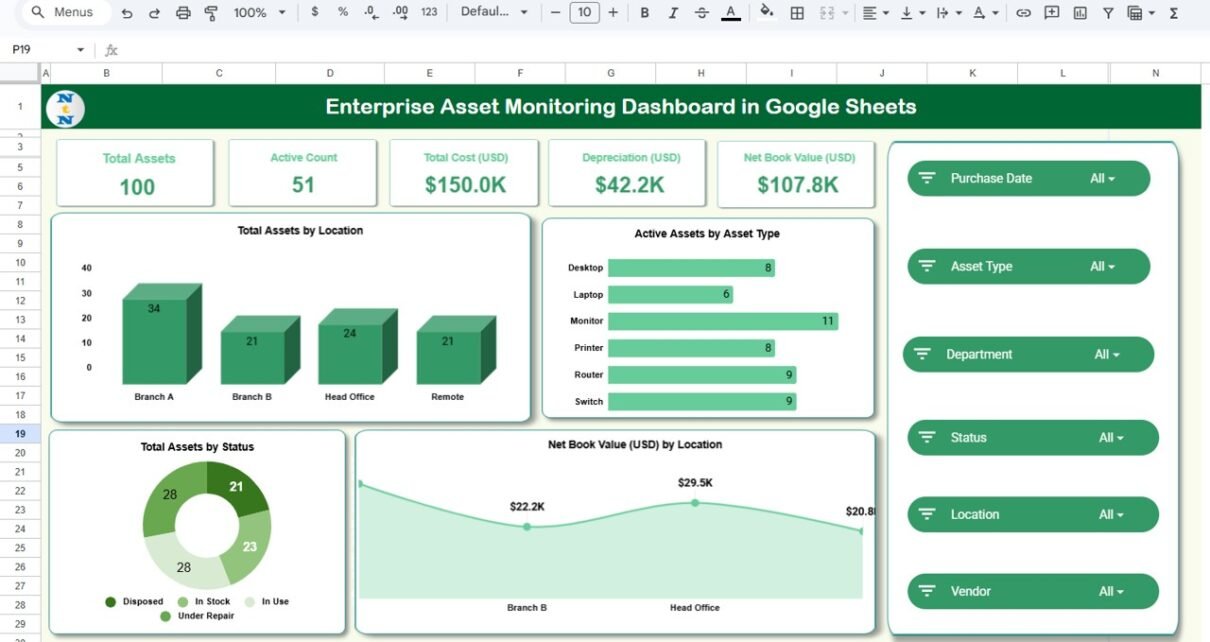
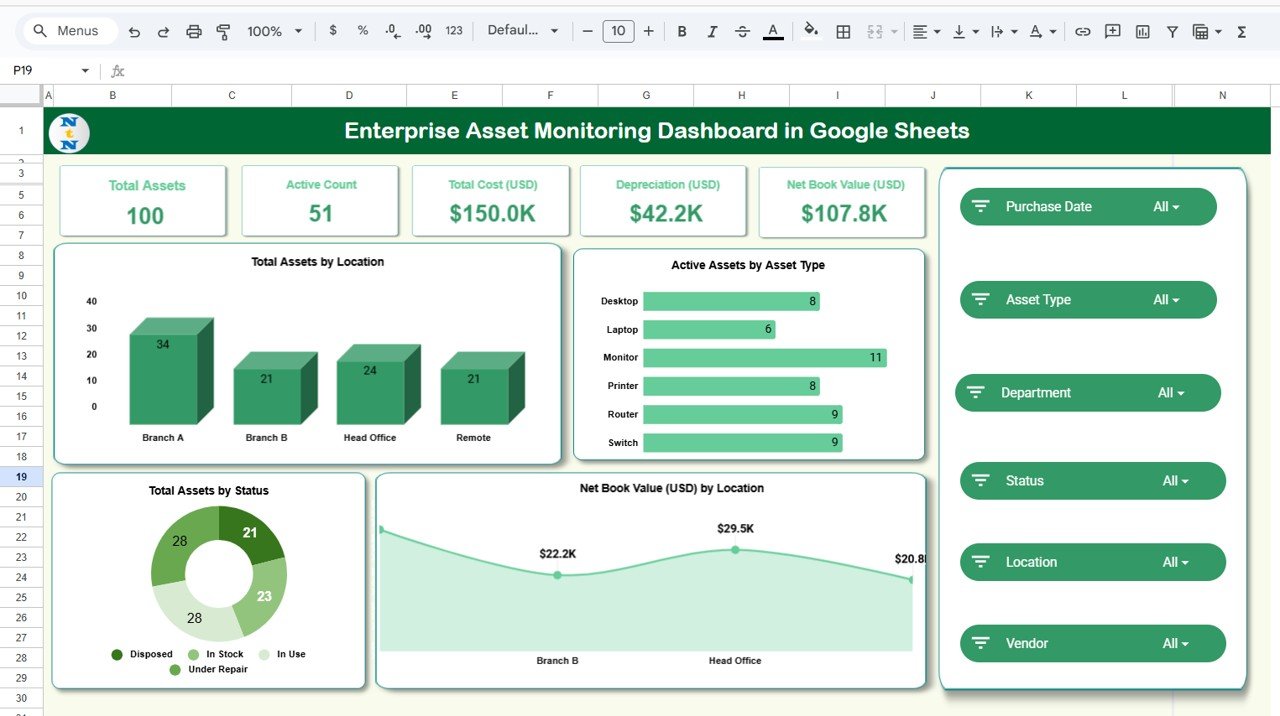
The Overview section gives a high-level snapshot of your enterprise’s asset health.
Cards
The dashboard displays essential asset management KPIs:
-
Total Assets – Total number of assets owned by the organization.
-
Active Count – Number of assets currently active or in-use.
-
Total Cost (USD) – Sum of procurement cost of all assets.
-
Depreciation (USD) – Total accumulated depreciation for all assets.
-
Net Book Value (USD) – Current value of assets after depreciation.
These KPIs help financial, procurement, and operations teams assess asset value instantly.
Overview Dashboard Charts
The dashboard includes visual charts that give critical insights:
1️⃣ Total Assets by Location
Shows the distribution of assets across different office locations or sites.
2️⃣ Active Assets by Asset Type
Shows which types of assets (e.g., Laptops, Machinery, Vehicles, Furniture) are actively used.
3️⃣ Net Book Value (USD) by Location
Displays current asset value across different geographic locations.
4️⃣ Total Assets by Status
Visualizes how many assets are active, inactive, damaged, under repair, or retired.
Click to Buy Enterprise Asset Monitoring Dashboard in Google Sheets
Asset Type Analysis
This section helps analyze asset performance and value by Asset Type.
Charts Included:
-
Under Warranty Assets by Asset Type
-
Net Book Value (USD) by Asset Type
-
Depreciation (USD) by Asset Type
-
Inactive Count by Asset Type

Asset Type Analysis
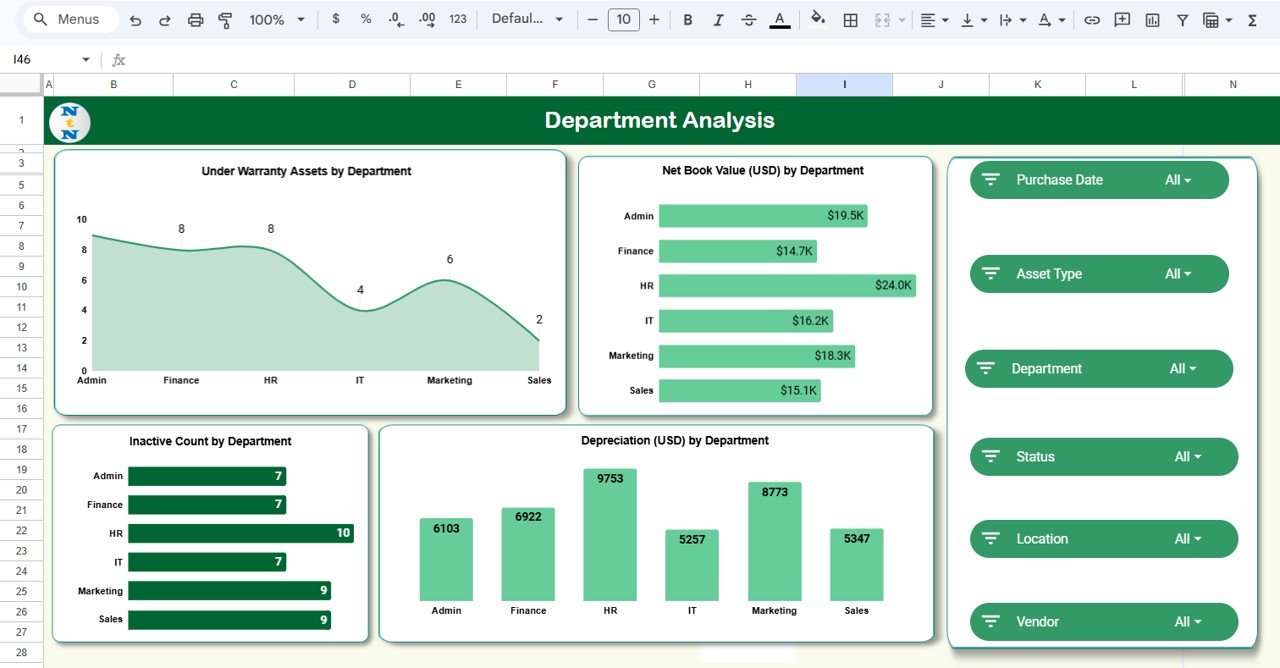
Department Analysis
This section focuses on department-wise asset performance.
Charts Included:
-
Under Warranty Assets by Department
-
Net Book Value (USD) by Department
-
Depreciation (USD) by Department
-
Inactive Count by Department
Click to Buy Enterprise Asset Monitoring Dashboard in Google Sheets
Vendor Analysis
Vendors play a significant role in asset quality and long-term cost efficiency.
This dashboard provides visibility into how each vendor’s assets perform.
Charts Included:
-
Under Warranty Assets by Vendor
-
Net Book Value (USD) by Vendor
-
Depreciation (USD) by Vendor
-
Inactive Count by Vendor

Click to Buy Enterprise Asset Monitoring Dashboard in Google Sheets
Monthly Trends
The Monthly Trends tab gives a timeline-based view of asset performance.
Charts Included:
-
Net Book Value (USD) by Month
-
Depreciation (USD) by Month
-
Inactive Count by Month

Search Tab
The Search Tab allows quick access to any asset record.

Click to Buy Enterprise Asset Monitoring Dashboard in Google Sheets
Data Sheet Tab
The Data Sheet is the core sheet where all asset information is stored.

Advantages of the Enterprise Asset Monitoring Dashboard
-
Complete visibility of all assets
-
Real-time updates when new assets are added
-
Depreciation tracking for accounting and reporting
-
Warranty monitoring to reduce repair costs
-
Vendor performance evaluation
-
Department-wise accountability
-
Search functionality for faster audits
-
Cost-effective—built entirely in Google Sheets
This dashboard helps companies reduce asset losses, optimize maintenance, and improve financial management.
Opportunities for Improvement
Click to Buy Enterprise Asset Monitoring Dashboard in Google Sheets
Your dashboard can be enhanced with the following features:
-
QR Code-based asset scanning
-
Automated email alerts for warranty expiry
-
Repair & Maintenance tracker
-
Integration with Google Forms for asset requests or issue logging
-
Asset lifecycle forecasting using formulas
-
User access permissions for sensitive financial data
Best Practices for Asset Monitoring
-
Keep the Data Sheet updated weekly or monthly.
-
Use consistent naming for asset types and departments.
-
Review inactive or damaged assets regularly.
-
Set color-coded warnings for expiring warranties.
-
Maintain accurate depreciation formulas for accounting.
-
Backup asset data monthly using version history.
-
Share read-only dashboards with department leaders.
Conclusion
Click to Buy Enterprise Asset Monitoring Dashboard in Google Sheets
The Enterprise Asset Monitoring Dashboard in Google Sheets is a comprehensive, easy-to-use, and cost-effective solution for tracking asset value, condition, warranty status, and depreciation. It empowers organizations to make strategic decisions, control costs, and improve asset lifecycle management.
Whether you’re managing a small IT inventory or a large enterprise asset base, this dashboard gives you full clarity and control.
Frequently Asked Questions (FAQ)
1. Can I track asset depreciation automatically?
Yes — include formulas based on cost, useful life, and purchase date.
2. Can I use this dashboard for multiple locations?
Absolutely. The dashboard has dedicated charts for location-wise tracking.
3. Can I add QR codes for each asset?
Yes — add QR codes linking to each asset record in Google Sheets.
4. Does the dashboard update automatically?
Yes, all charts and KPIs refresh when data changes.
5. Can it handle thousands of assets?
Yes, Google Sheets can efficiently manage large asset inventories.
Visit our YouTube channel to learn step-by-step video tutorials
Youtube.com/@NeotechNavigators
Watch the step-by-step video Demo:
Click to Buy Enterprise Asset Monitoring Dashboard in Google Sheets