Managing an enterprise involves overseeing a vast array of processes, from finance and sales to human resources and supply chain operations. Enterprise Resource Planning (ERP) systems integrate these processes into a unified system. To track and monitor the effectiveness of an ERP system, it’s essential to measure specific key performance indicators (KPIs). The Enterprise Resource Planning KPI Dashboard in Google Sheets provides a comprehensive tool for visualizing and analyzing these KPIs.
In this article, we will explore the features of the ERP KPI Dashboard in Google Sheets, how it works, and how you can use it to track performance, set targets, and ensure that your organization is meeting its business goals.
What is the Enterprise Resource Planning KPI Dashboard?
The ERP KPI Dashboard in Google Sheets is a template designed to help businesses track and visualize the performance of various business processes within an ERP system. This dashboard tracks KPIs in key areas such as sales, inventory, finance, and human resources, providing real-time insights into how the business is performing against set targets.
By consolidating and visualizing data in a simple and accessible format, this dashboard helps managers and stakeholders make informed decisions to improve operational efficiency.
Key Features of the ERP KPI Dashboard in Google Sheets
Click to buy Enterprise Resource Planning KPI Dashboard in Google Sheets
The ERP KPI Dashboard is built around six main worksheets, each offering different insights into various KPIs. Let’s take a closer look at the key features:
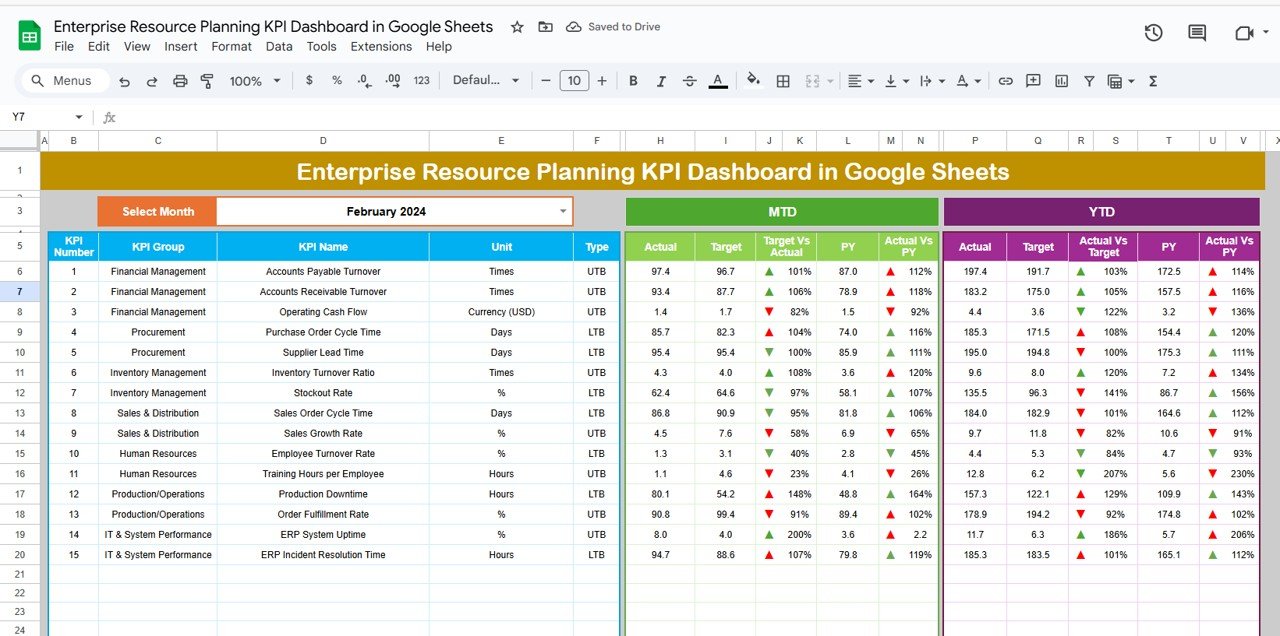
1. Dashboard Sheet Tab (Main Sheet)
This sheet provides a snapshot of all the KPIs that are being tracked, including both MTD (Month-to-Date) and YTD (Year-to-Date) data. It allows users to quickly assess the current state of the business by displaying key metrics, targets, and comparisons.
Key Metrics on Dashboard:
-
MTD Actual: Displays the actual performance for the current month.
-
Target: Shows the set target for the current month.
-
Previous Year (PY) Data: Compares current data to the same period from the previous year.
-
Target vs Actual: Displays the performance difference between the target and the actual values.
-
PY vs Actual: Compares the previous year’s performance with the current year’s data.
-
Conditional Formatting: Uses up and down arrows to indicate whether the current performance is above or below the target.
Click to buy Enterprise Resource Planning KPI Dashboard in Google Sheets
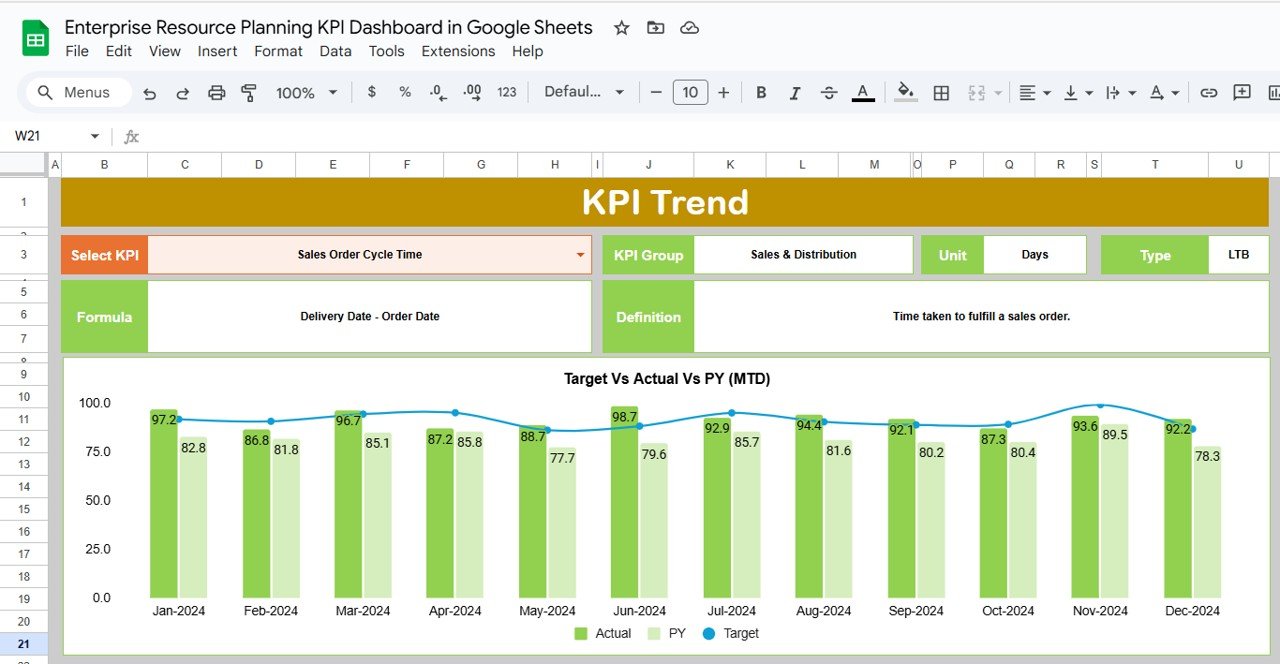
2. KPI Trend Sheet Tab
The KPI Trend Sheet allows users to track the historical performance of KPIs over time. Users can select the KPI they want to analyze from a dropdown menu, and the sheet will display the trends for that KPI, showing how it has performed in past periods.
Key Information Displayed:
-
KPI Group: Grouping of KPIs based on their respective categories (e.g., financial, operational, human resources).
-
Unit of KPI: The unit used for measuring the KPI (e.g., dollars, units sold, satisfaction score).
-
Type of KPI: Specifies whether the KPI is “Lower the better” or “Upper the better.”
-
Formula of KPI: The calculation used to derive the KPI.
-
Definition: A brief description of what the KPI represents.
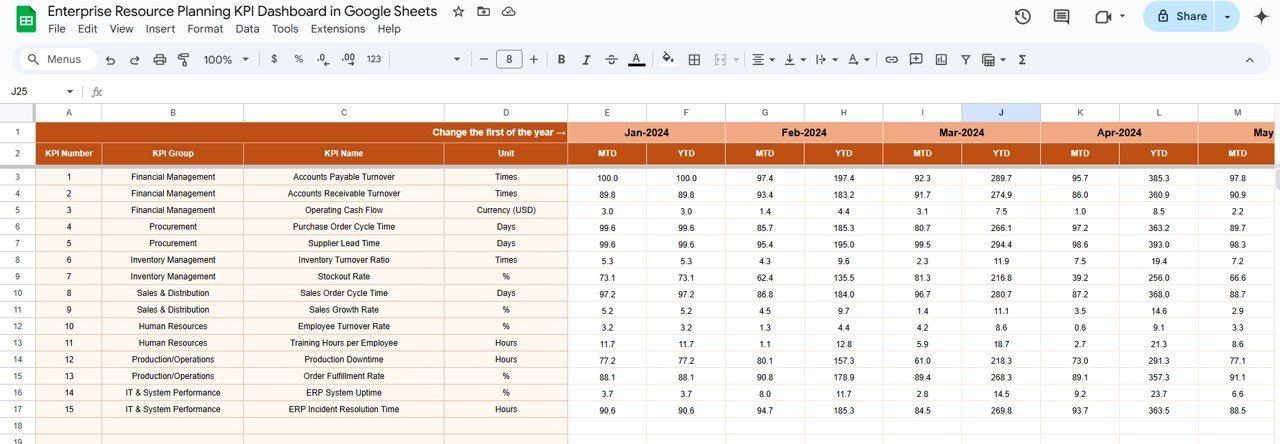
3. Actual Number Sheet Tab
The Actual Number Sheet is where users enter the actual performance data for each KPI. This sheet allows you to track the MTD and YTD actual performance and compare it to the target.
Features of the Sheet:
-
Input Fields: Users input actual values for each KPI, which are then displayed on the Dashboard Sheet.
-
Monthly Adjustments: Users can change the month from the dropdown, and the dashboard will update accordingly.
Click to buy Enterprise Resource Planning KPI Dashboard in Google Sheets
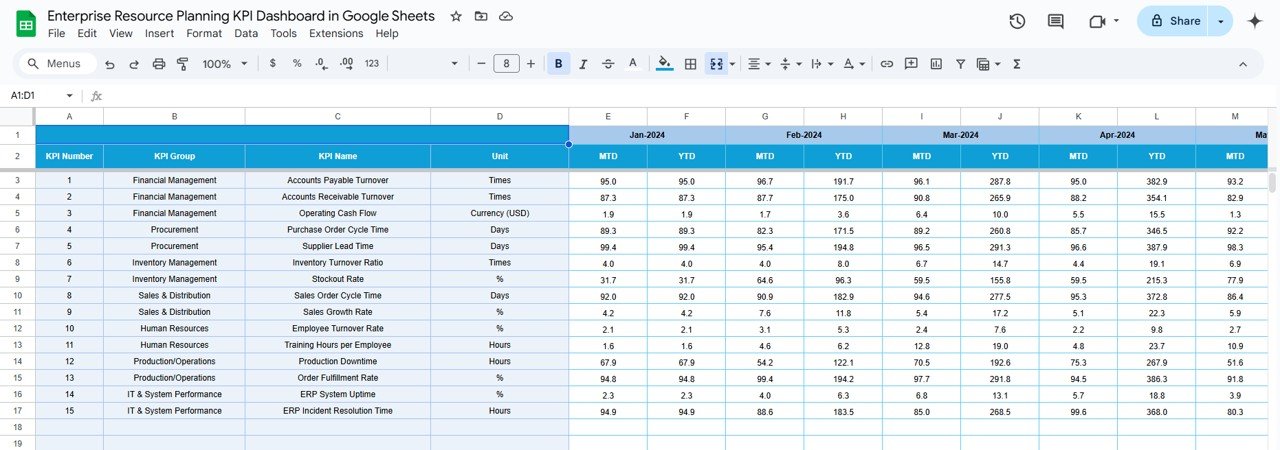
4. Target Sheet Tab
This sheet is used to enter the target numbers for each KPI. Users can input monthly and yearly targets for each KPI, which will be displayed in comparison with the actual performance on the Dashboard Sheet.
-
Monthly and Yearly Targets: Enter monthly and annual targets for various KPIs.
-
Tracking Progress: Allows you to track progress towards goals and identify areas where targets are not being met.
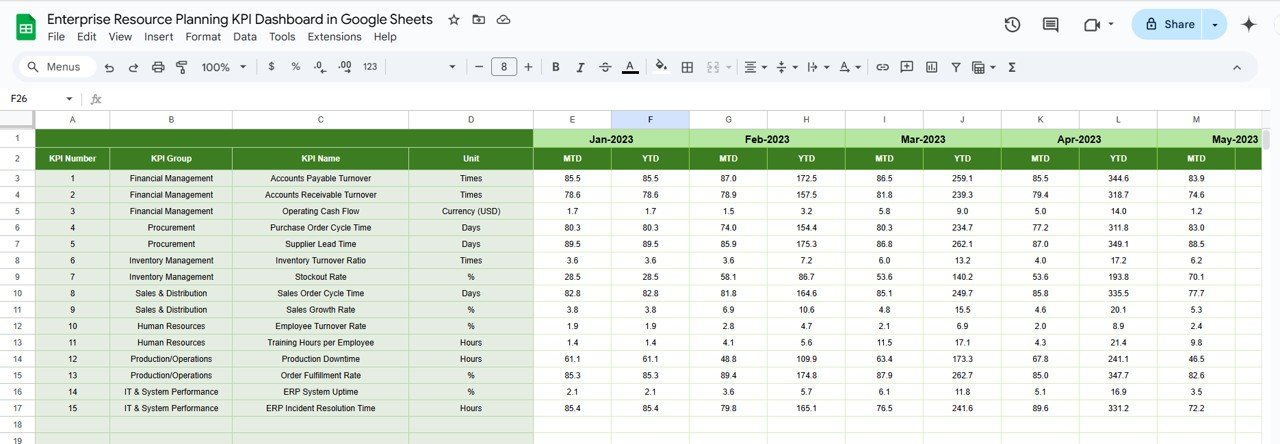
5. Previous Year Data Sheet Tab
The Previous Year Data sheet allows users to input performance data from the previous year, which is then compared to the current year’s performance.
-
Historical Comparison: Helps to compare performance trends from the previous year against the current year.
-
Adjustable Inputs: Enter data for each month of the previous year to get accurate year-over-year comparisons.
Click to buy Enterprise Resource Planning KPI Dashboard in Google Sheets
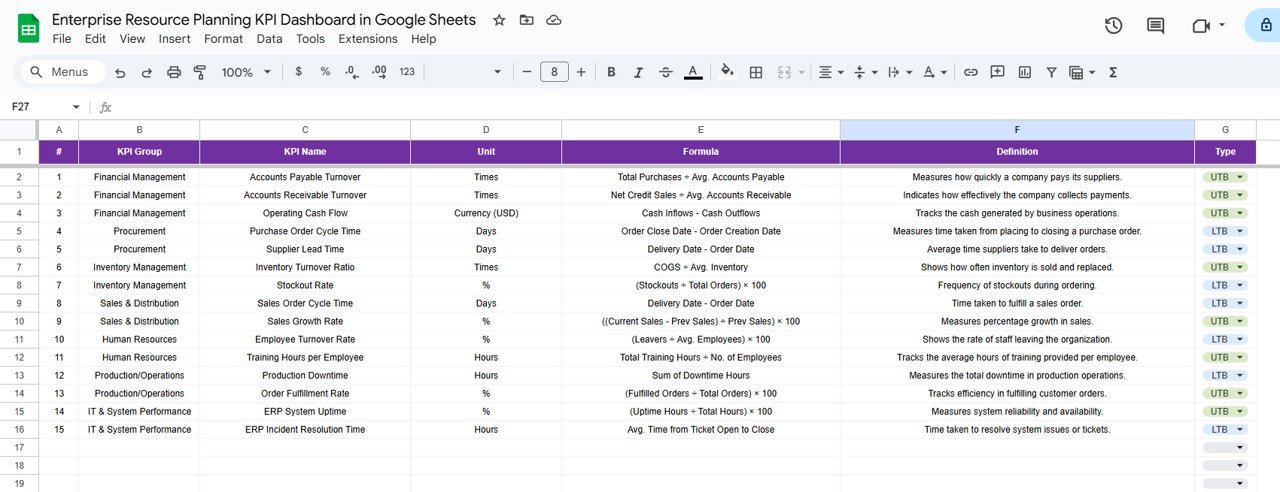
6. KPI Definition Sheet Tab
The KPI Definition sheet provides detailed information about each KPI, including its formula, definition, and unit of measurement.
Features:
-
KPI Name: The name of the KPI (e.g., Sales, Profit Margin).
-
KPI Group: Grouping based on category (e.g., Financial, Operational).
-
Unit: The unit used for measuring the KPI (e.g., dollars, units).
-
Formula: The formula used to calculate the KPI.
-
Definition: A description of what the KPI measures and how it impacts the business.
Benefits of Using the ERP KPI Dashboard in Google Sheets
Click to buy Enterprise Resource Planning KPI Dashboard in Google Sheets
The ERP KPI Dashboard in Google Sheets offers several advantages for businesses looking to track and improve their performance:
-
Centralized Data Tracking: The dashboard consolidates all important business data in one place, making it easier to manage and monitor performance.
-
Real-Time Insights: The dashboard updates automatically as you input new data, providing real-time insights into business performance.
-
Customizable: You can tailor the dashboard to your specific business needs by adding or removing KPIs, adjusting formulas, and modifying the layout.
-
Visual Representation: The use of charts and conditional formatting allows for easy data interpretation, helping you quickly identify areas that need attention.
-
Improved Decision-Making: By visualizing key metrics and comparing them against targets, businesses can make informed decisions to optimize operations and achieve goals.
Best Practices for Using the ERP KPI Dashboard
To maximize the effectiveness of the ERP KPI Dashboard in Google Sheets, consider these best practices:
-
Regularly Update Data: Keep your data current by regularly inputting updated figures for both targets and actual performance.
-
Set Realistic Targets: Ensure your targets are achievable and aligned with your business goals. Adjust them as necessary based on changing market conditions.
-
Monitor Key Trends: Use the KPI Trend Sheet to monitor how KPIs have evolved over time and identify patterns or issues that need attention.
-
Review Monthly: Regularly review the dashboard at the end of each month to assess performance, identify trends, and make adjustments to improve results.
-
Collaborate: Share the dashboard with key team members so they can track performance and provide input on areas for improvement.
Conclusion
Click to buy Enterprise Resource Planning KPI Dashboard in Google Sheets
The Enterprise Resource Planning KPI Dashboard in Google Sheets is an invaluable tool for businesses looking to track and manage key performance indicators. It provides a comprehensive overview of business performance, consolidates critical data, and allows for real-time analysis of operational and financial metrics. By using this dashboard, businesses can make informed decisions, monitor progress toward goals, and drive continuous improvement across departments.
Frequently Asked Questions (FAQs)
1. What KPIs are tracked in the ERP KPI Dashboard?
The dashboard tracks KPIs such as sales, profit margins, inventory turnover, employee efficiency, and more, depending on your business needs.
2. Can I customize the dashboard?
Yes, the dashboard is fully customizable. You can add, remove, or modify KPIs and adjust formulas to suit your business goals.
3. How do I update the dashboard with new data?
You can update the dashboard by entering actual performance data in the Actual Number Sheet and inputting target data in the Target Sheet.
4. How often should I update the dashboard?
It’s recommended to update the dashboard at least once a month to keep the data current and track progress effectively.
Visit our YouTube channel to learn step-by-step video tutorials
Youtube.com/@NeotechNavigators
Watch the step-by-step video Demo:
Click to buy Enterprise Resource Planning KPI Dashboard in Google Sheets