Events play a crucial role in modern business growth. Organizations invest heavily in conferences, exhibitions, webinars, product launches, and marketing campaigns to generate leads and strengthen brand visibility. However, many companies struggle to measure whether their events truly deliver value. As a result, decision-makers often rely on assumptions instead of data.
So, how can businesses accurately measure event success and calculate real return on investment?
The answer lies in a structured and data-driven solution — the Event ROI KPI Dashboard in Google Sheets.
This comprehensive guide explains everything you need to know about the Event ROI KPI Dashboard, including its features, structure, benefits, implementation process, best practices, and frequently asked questions.
What Is an Event ROI KPI Dashboard in Google Sheets?
Click to Buy Event ROI KPI Dashboard in Google Sheets
An Event ROI KPI Dashboard in Google Sheets is a ready-to-use performance monitoring tool designed to track event effectiveness using Key Performance Indicators (KPIs).
Instead of analyzing multiple reports manually, this dashboard consolidates all event metrics into one interactive Google Sheets environment. Consequently, marketers, event managers, and business leaders can evaluate performance instantly.
The dashboard includes KPIs with:
- Units of measurement
- Aggregation formulas
- KPI definitions
- KPI type classification (Lower the Better or Upper the Better)
Because Google Sheets works in the cloud, teams can collaborate in real time while maintaining a single source of truth.
Why Is Event ROI Measurement Important?
Many organizations spend large budgets on events. However, without structured tracking, they cannot determine whether the investment generates meaningful returns.
Common Challenges Without KPI Tracking
- Difficulty measuring event profitability
- Lack of performance visibility
- Inconsistent reporting methods
- Delayed decision-making
- Poor budget allocation for future events
Therefore, businesses need a standardized KPI dashboard to measure results clearly.
Key Features of the Event ROI KPI Dashboard in Google Sheets
Click to Buy Event ROI KPI Dashboard in Google Sheets
This dashboard provides a structured framework for analyzing event performance using automation and visual analytics.
Core Features
- Monthly KPI performance tracking
- Target vs Actual comparison
- Previous year performance analysis
- Dynamic month selection
- Conditional formatting indicators
- YTD and MTD performance monitoring
- KPI definitions and formulas included
As a result, users can track both short-term and long-term performance efficiently.
Dashboard Structure: Worksheets Included
The Event ROI KPI Dashboard consists of six structured worksheets, each designed for a specific analytical purpose.
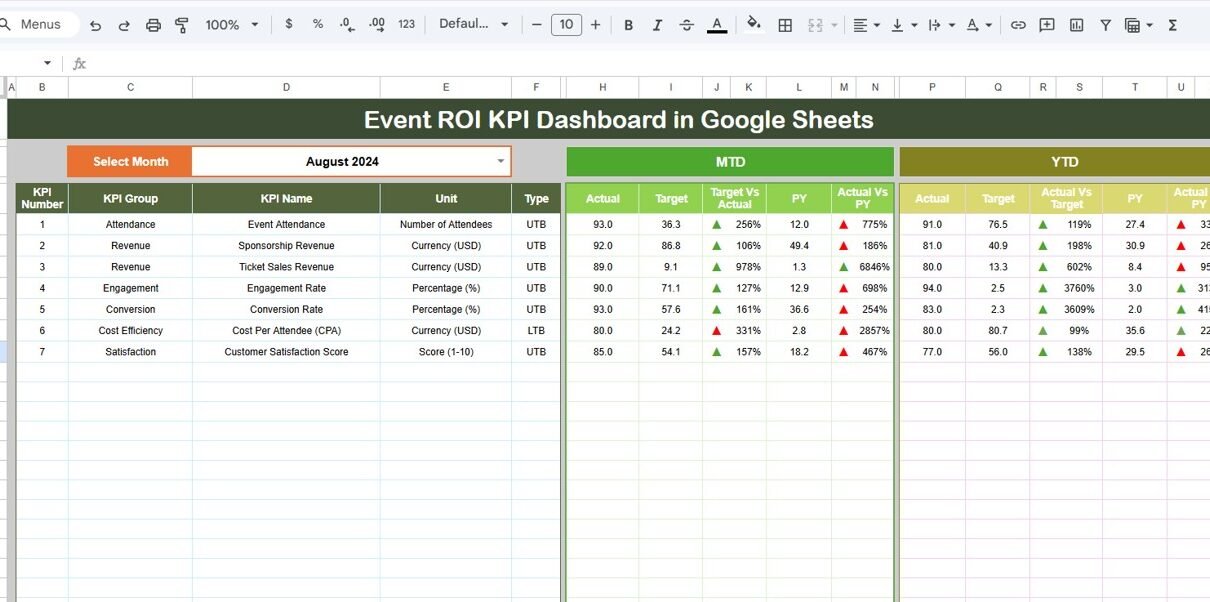
Dashboard Sheet Tab – Main Performance Overview
The Dashboard Sheet acts as the central reporting interface.
Here, users can view all KPIs in one place.
Month Selection Feature
-
Located in Range D3
-
Users select a month from a dropdown list
-
Entire dashboard updates automatically
Because of this dynamic selection, performance analysis becomes quick and flexible.
KPI Metrics Displayed
The dashboard shows:
MTD (Month-To-Date) Metrics
- MTD Actual
- MTD Target
- Previous Year MTD
- Target vs Actual %
- PY vs Actual %
YTD (Year-To-Date) Metrics
- YTD Actual
- YTD Target
- Previous Year YTD
- Target vs Actual %
- PY vs Actual %
Conditional Formatting Indicators
The dashboard uses visual arrows:
- ▲ Green Arrow → Positive performance
- ▼ Red Arrow → Performance below expectation
Therefore, users understand KPI status instantly without manual calculations.

Click to Buy Event ROI KPI Dashboard in Google Sheets
KPI Trend Sheet Tab – Performance Trend Analysis
The KPI Trend Sheet focuses on individual KPI analysis over time.
Interactive KPI Selection
- KPI dropdown located in Range C3
- Select any KPI dynamically
Once selected, the dashboard displays:
- KPI Group
- KPI Unit
- KPI Type (LTB or UTB)
- KPI Formula
- KPI Definition
Because trend visualization helps identify patterns, managers can analyze performance behavior effectively.

Actual Number Sheet Tab – Data Entry for Current Performance
This sheet captures actual performance values.
How to Use
-
Enter the first month of the year in Range E1
-
Input Actual MTD values
-
Input Actual YTD values
The dashboard automatically calculates results using these inputs.
Consequently, updating performance data becomes simple and structured.

Click to Buy Event ROI KPI Dashboard in Google Sheets
Target Sheet Tab – KPI Goal Management
The Target Sheet defines expected performance levels.
Users must enter:
-
Monthly MTD Targets
-
Monthly YTD Targets
Targets allow the dashboard to calculate achievement percentages automatically.
Therefore, managers can evaluate success against business goals.

Previous Year Number Sheet Tab – Historical Comparison
This worksheet stores prior-year performance data.
Users enter previous-year numbers exactly as current-year data.
Because historical comparison remains essential, this sheet enables:
-
Year-over-year analysis
-
Growth measurement
-
Performance benchmarking

Click to Buy Event ROI KPI Dashboard in Google Sheets
KPI Definition Sheet Tab – KPI Documentation
The KPI Definition Sheet ensures reporting consistency.
Users enter:
-
KPI Name
-
KPI Group
-
Unit
-
Formula
-
KPI Definition
-
KPI Type (LTB or UTB)
This centralized documentation improves transparency and understanding across teams.

Click to Buy Event ROI KPI Dashboard in Google Sheets
Advantages of Event ROI KPI Dashboard in Google Sheets
Centralized Event Analytics
All KPIs remain available in one dashboard.
Real-Time Collaboration
Teams access and update data simultaneously.
Automated Calculations
Formulas eliminate manual errors.
Better Budget Decisions
ROI visibility improves investment planning.
Easy Customization
Users can add or modify KPIs anytime.
Cloud Accessibility
Access dashboard from anywhere.
Improved Performance Monitoring
Visual indicators highlight performance instantly.
How Does This Dashboard Improve Event Strategy?
When organizations analyze event data consistently, strategy improves naturally.
The dashboard helps teams:
-
Identify high-performing events
-
Optimize marketing spending
-
Improve attendee engagement
-
Increase event profitability
Consequently, businesses make smarter future investments.
Best Practices for the Event ROI KPI Dashboard in Google Sheets
Click to Buy Event ROI KPI Dashboard in Google Sheets
To maximize effectiveness, follow these best practices.
1. Define Clear Event Objectives
Always align KPIs with business goals.
2. Maintain Accurate Data Entry
Ensure numbers remain consistent across sheets.
3. Update Data Monthly
Regular updates keep insights relevant.
4. Use KPI Types Correctly
Assign LTB or UTB carefully.
5. Monitor Trends Regularly
Focus on patterns instead of isolated results.
6. Review Targets Quarterly
Adjust goals based on performance outcomes.
7. Train Team Members
Ensure everyone understands KPI definitions.
Why Choose Google Sheets for Event KPI Tracking?
Google Sheets provides flexibility and accessibility.
Key Benefits
- Cloud-based collaboration
- No software installation required
- Automatic saving
- Easy sharing with stakeholders
- Integration with other tools
Therefore, it becomes an ideal platform for event analytics.
Future of Event Analytics and ROI Measurement
Click to Buy Event ROI KPI Dashboard in Google Sheets
Event analytics continues evolving rapidly. Organizations increasingly adopt data-driven decision-making.
Future developments may include:
- AI-powered event predictions
- Automated attendee behavior analysis
- Real-time engagement tracking
- Advanced marketing attribution models
Hence, KPI dashboards will remain essential tools for modern event management.
Conclusion
Measuring event success requires more than attendance numbers. Organizations must evaluate financial performance, engagement metrics, and long-term impact.
The Event ROI KPI Dashboard in Google Sheets provides a structured and user-friendly solution to track event performance effectively. By combining MTD and YTD analysis, historical comparison, KPI documentation, and visual indicators, the dashboard transforms raw event data into actionable insights.
As a result, businesses improve decision-making, optimize budgets, and maximize event returns.
Ultimately, organizations that measure performance consistently achieve better outcomes and sustainable growth.
Frequently Asked Questions (FAQs)
Click to Buy Event ROI KPI Dashboard in Google Sheets
What is an Event ROI KPI Dashboard?
It is a Google Sheets dashboard that tracks event performance using KPIs such as revenue, leads, and ROI metrics.
Do I need advanced skills to use this dashboard?
No. You only need to enter data in input sheets, and calculations update automatically.
What does LTB and UTB mean?
-
LTB (Lower the Better): Lower values indicate better performance.
-
UTB (Upper the Better): Higher values indicate better performance.
Can I customize KPIs?
Yes. You can add or modify KPIs using the KPI Definition sheet.
How often should I update data?
You should update data monthly or after each event.
Can multiple users work on the dashboard?
Yes. Google Sheets allows real-time collaboration.
Does the dashboard compare previous year performance?
Yes. The Previous Year sheet enables year-over-year comparison.
Watch the step-by-step video tutorial:
Visit our YouTube channel to learn step-by-step video tutorials