In today’s digital era, fans are not just spectators—they are active participants who shape the success of sports teams, entertainment brands, musicians, and content creators. Measuring and improving fan engagement is essential for sustaining long-term loyalty and growth.
The Fan Engagement KPI Dashboard in Google Sheets provides a simple yet powerful way to track engagement metrics, monitor trends, and evaluate performance—all within a familiar, cloud-based spreadsheet environment.
This article explores how the dashboard works, its key features, advantages, best practices, and how it empowers organizations to build stronger connections with their audience.
Click to buy Fan Engagement KPI Dashboard in Google sheets
What Is a Fan Engagement KPI Dashboard in Google Sheets?
A Fan Engagement KPI Dashboard is an interactive visual tool that helps teams, brands, and creators measure fan interactions, participation, and sentiment over time. Built entirely in Google Sheets, this dashboard consolidates data from multiple engagement sources—such as social media platforms, events, surveys, and digital campaigns—into one place.
By tracking critical Key Performance Indicators (KPIs), teams can understand how their fans respond to content, events, and promotions, leading to better decision-making and strategy refinement.
Unlike complicated analytics tools, this Google Sheets-based dashboard is:
- Easy to use – No coding or add-ons required.
- Collaborative – Multiple stakeholders can update and view data in real time.
- Customizable – Adaptable for sports leagues, artists, event organizers, and influencers.
Structure of the Fan Engagement KPI Dashboard
This ready-to-use template includes six worksheet tabs, each designed to streamline data management and reporting:
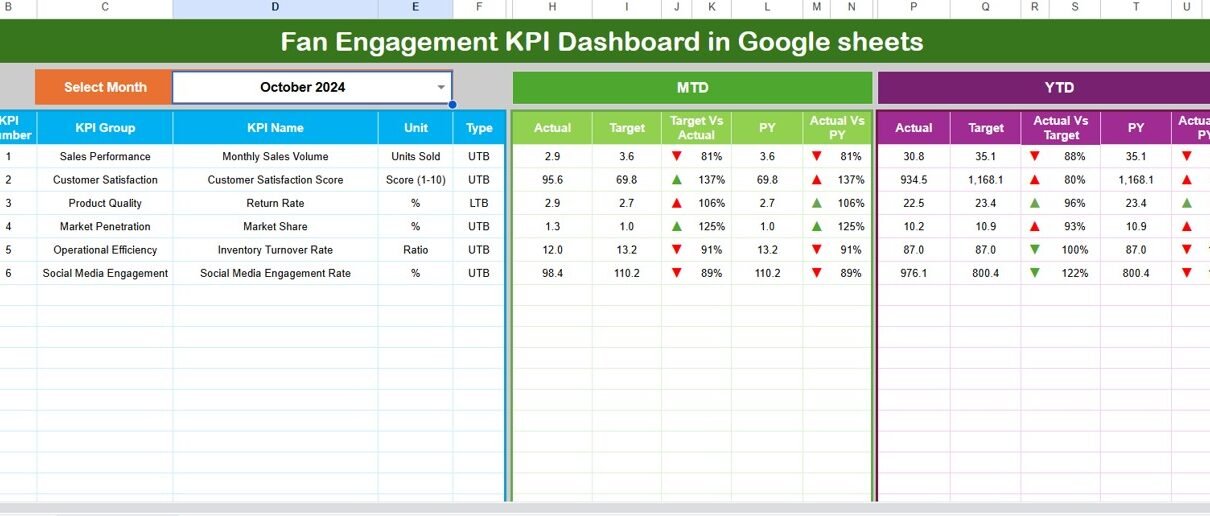
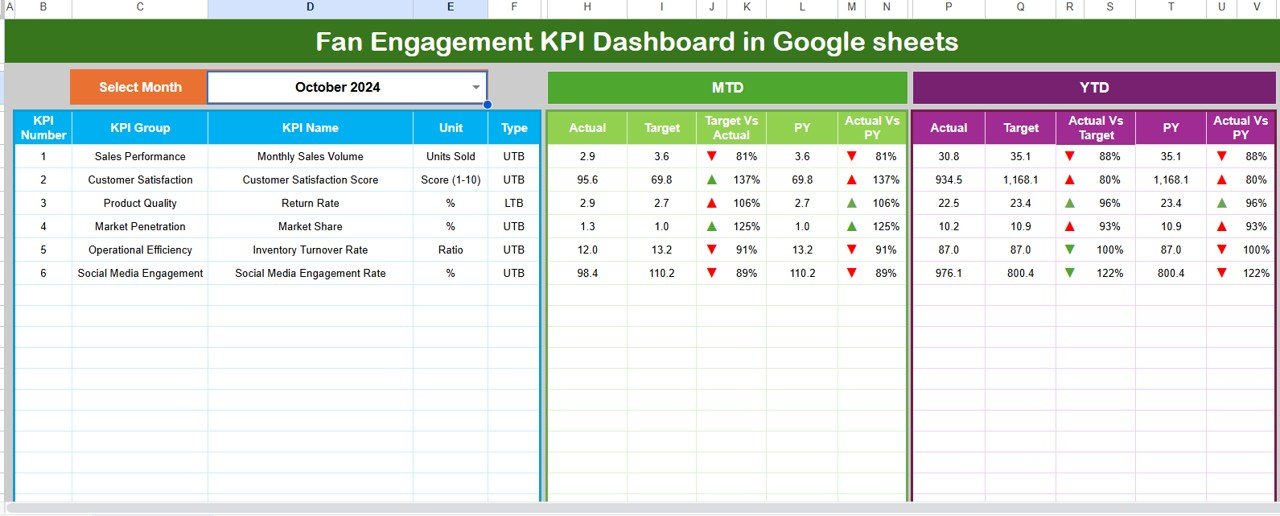
Dashboard Sheet Tab
The Dashboard Sheet is the main visual hub. Here, users can analyze all KPIs in one consolidated view.
- A month selector (cell D3) allows users to view data for a chosen month.
- Automatically updates MTD (Month-to-Date) and YTD (Year-to-Date) values.
- Displays comparisons between Actual, Target, and Previous Year data.
- Includes conditional formatting with green/red arrows to indicate performance trends (Target vs Actual and PY vs Actual).
This tab makes performance tracking quick, clear, and actionable.
Click to buy Fan Engagement KPI Dashboard in Google sheets
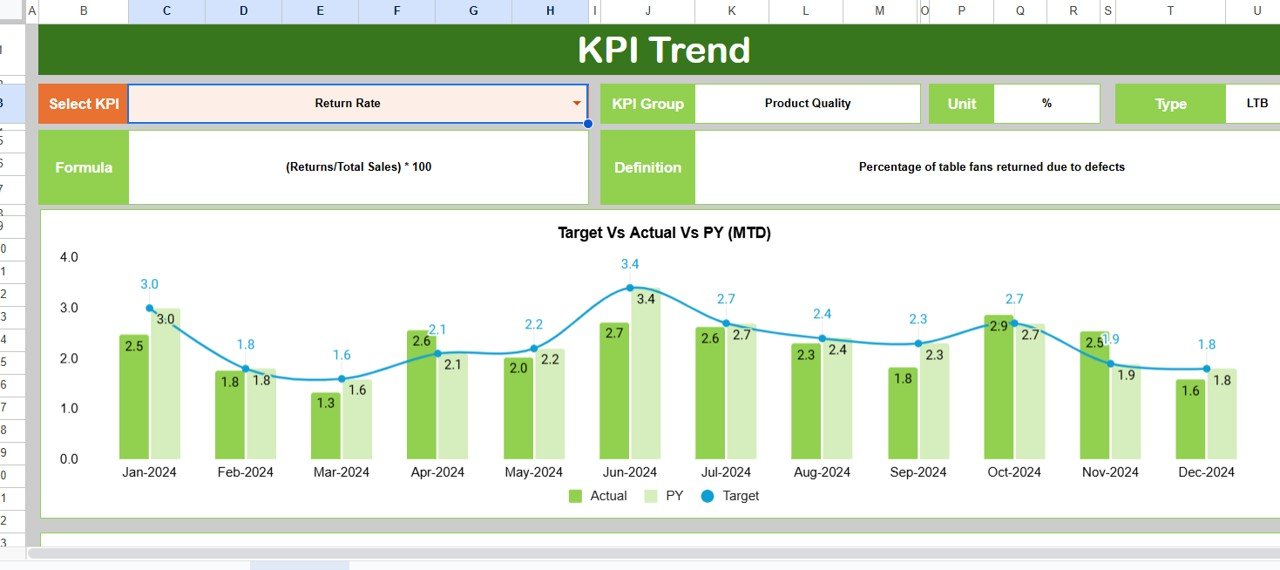
KPI Trend Sheet Tab
The Trend Sheet provides an in-depth view of each KPI’s behavior over time.
- Select any KPI from a drop-down menu (cell C3).
- View KPI Group, Unit, Type (LTB/UTB), Formula, and Definition.
- Automatically generates MTD and YTD trend charts for Actual, Target, and PY data.
This visual layout helps managers quickly identify upward or downward trends in engagement and take proactive measures.
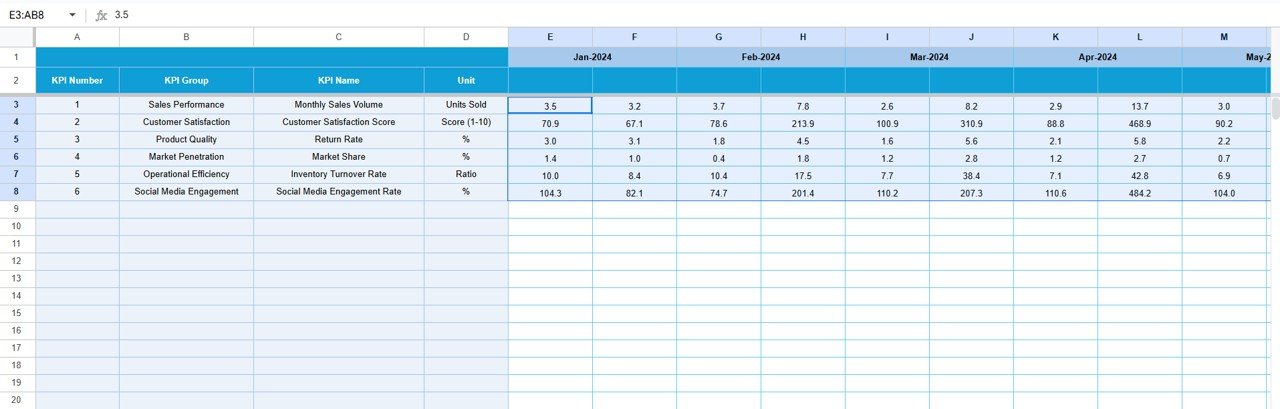
Actual Numbers Input Sheet
Data accuracy is key for reliable insights.
- Enter MTD and YTD actual data for each month.
- Update the starting month from cell E1—ideal for flexible calendar year tracking.
- Each KPI is listed clearly, minimizing data entry errors.
This sheet ensures the dashboard stays current with real engagement results.
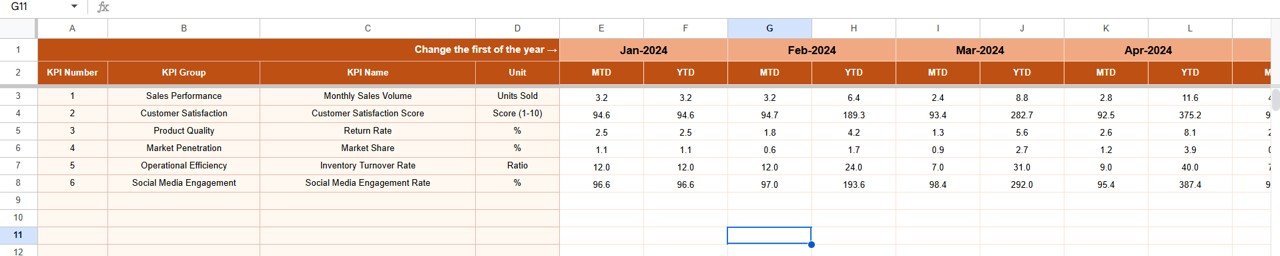
Target Sheet Tab
The Target Sheet defines performance goals.
- Enter monthly and yearly targets for each KPI.
- Helps align marketing and engagement objectives with strategic outcomes.
- Provides the baseline for comparing Actual vs Target progress in the Dashboard.
-
Target Sheet Tab
Previous Year Numbers Sheet
Historical data adds valuable context.
- Enter previous year’s data for all KPIs in the same MTD/YTD structure.
- Enables easy year-over-year performance comparison.
- Useful for identifying seasonal trends or recurring engagement spikes.

KPI Definition Sheet Tab
This reference sheet documents every KPI used in the dashboard.
- Columns include KPI Name, Group, Unit, Formula, and Definition.
- Ensures clarity and consistency for all users.
- Supports data governance and reduces ambiguity.
By maintaining this sheet, teams can onboard new users easily and maintain standard definitions for key metrics.

Key Fan Engagement KPIs to Track
The dashboard supports a wide variety of KPIs depending on the use case. Some popular engagement metrics include:
- Total Followers or Subscribers – Measures audience base growth.
- Engagement Rate (%) – Interaction divided by total reach or impressions.
- Average Comments per Post – Indicates fan activity and feedback level.
- Share or Retweet Count – Measures virality and content amplification.
- Event Attendance (%) – Shows participation in physical or virtual events.
- Ticket Sales or Redemptions – Tracks conversion of engagement into revenue.
- Geographical Reach – Analyzes audience distribution by region.
- Platform Performance – Compares engagement across social media platforms.
- Fan Loyalty Index – Weighted score reflecting repeat participation and satisfaction.
By customizing KPIs to their needs, organizations can focus on what truly drives fan relationships.
Why Use Google Sheets for Fan Engagement Dashboards?
Google Sheets offers flexibility and accessibility unmatched by many dedicated analytics tools.
Here’s why it’s an excellent choice for engagement dashboards:
- Real-time collaboration: Multiple users can view and edit simultaneously.
- Automatic saving and version control: No risk of data loss.
- Dynamic charts and conditional formatting: Provides instant visual insights.
- Custom formulas and built-in functions: Allow precise KPI calculations.
- Integration with Google Forms, Data Studio, or APIs: Simplifies data collection and visualization.
- Cost-effective: 100% free and accessible to any user with a Google account.
Advantages of Using a Fan Engagement KPI Dashboard in Google Sheets
Using this dashboard brings structure, transparency, and efficiency to engagement tracking.
1. Centralized Performance Monitoring
Instead of juggling multiple files or platforms, teams can track all engagement data in one place.
2. Easy Comparison of Actual, Target, and Historical Data
The MTD/YTD structure allows you to instantly see progress against goals and historical trends.
3. Enhanced Decision-Making
Visual charts and conditional formatting highlight where engagement is improving—or lagging—so you can act fast.
4. Customizable for Any Brand or Event
Adapt KPIs, visuals, and categories to fit sports clubs, entertainment shows, or fan communities.
5. Team Collaboration
Marketing, operations, and analytics teams can collaborate in real time. Everyone stays aligned on fan performance.
6. Reduced Manual Effort
Once the setup is done, all updates flow automatically with monthly data entry—no repeated formatting or calculations.
How to Use the Fan Engagement Dashboard Effectively
Follow these simple steps to make the most out of your dashboard:
- Define KPIs Clearly – Start with measurable, actionable metrics relevant to your goals.
- Collect Reliable Data – Use consistent data sources (social media analytics, CRM, surveys).
- Input Monthly Data – Update the Actual, Target, and PY sheets regularly.
- Use the Drop-Down Filters – Switch between months or KPIs easily to explore results.
- Analyze Visual Trends – Use the Dashboard and Trend sheets to find patterns.
- Take Timely Actions – Use insights to refine campaigns, content, and fan experiences
Conclusion
Fan engagement defines how deeply audiences connect with your brand, sport, or content. The Fan Engagement KPI Dashboard in Google Sheets simplifies this process, transforming raw numbers into meaningful insights.
With this dynamic, customizable, and cost-effective tool, teams can track MTD and YTD performance, compare targets, and visualize engagement growth over time. Whether you manage a sports team, artist brand, or online community, this dashboard helps you stay ahead by turning data into action.
Frequently Asked Questions (FAQs)
What is a Fan Engagement KPI Dashboard?
It’s an analytical tool built in Google Sheets to measure fan interactions, sentiment, and participation through customizable KPIs.
Can I use this dashboard for social media performance?
Yes. You can track KPIs like engagement rate, shares, likes, comments, and followers across platforms.
⃣ How often should I update the data?
Update the Actual and Target sheets monthly for consistent trend analysis.
Can this dashboard be used for non-sports industries?
Absolutely. It works for entertainment, music, influencers, and event management too.
Do I need any technical skills?
No. The dashboard is built entirely in Google Sheets with drop-downs, formulas, and charts that anyone can use.
How can I add new KPIs?
Add new entries in the KPI Definition Sheet and extend your Actual, Target, and Previous Year sheets accordingly.
Can I integrate this with Google Forms or Data Studio?
Yes. You can link Google Forms to collect fan data or connect Google Data Studio for advanced visualization.
⃣ What are the biggest benefits of this dashboard?
It centralizes all engagement data, supports collaboration, and delivers quick insights through easy-to-read visuals.
Visit our YouTube channel to learn step-by-step video tutorials
Youtube.com/@NeotechNavigators