Managing finances efficiently is crucial for any organization. Monitoring key financial metrics helps business leaders make informed decisions, identify trends, and optimize budgets. With the Financial Planning KPI Dashboard in Google Sheets, you can track, analyze, and visualize your financial performance in one ready-to-use tool.Financial Planning KPI Dashboard in Google Sheets
This dashboard is designed for finance teams, project managers, and decision-makers who want a clear view of their financial KPIs, including MTD (Month-to-Date), YTD (Year-to-Date), targets, and trends.Financial Planning KPI Dashboard in Google Sheets
Key Features of Financial Planning KPI Dashboard in Google Sheets
Our dashboard is built with 6 comprehensive worksheets to capture all financial metrics efficiently:
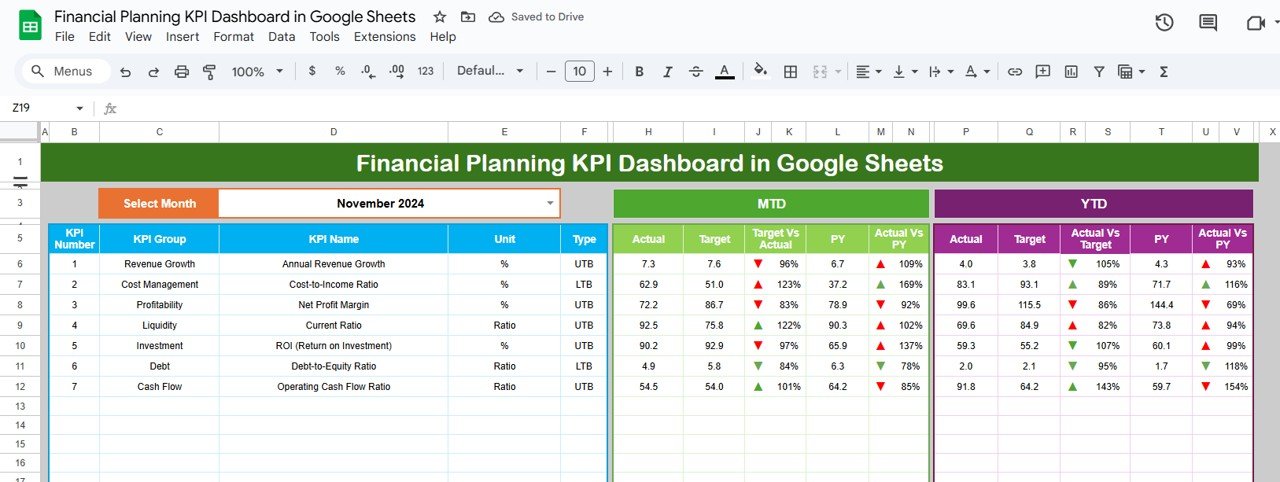
1. Dashboard Sheet Tab
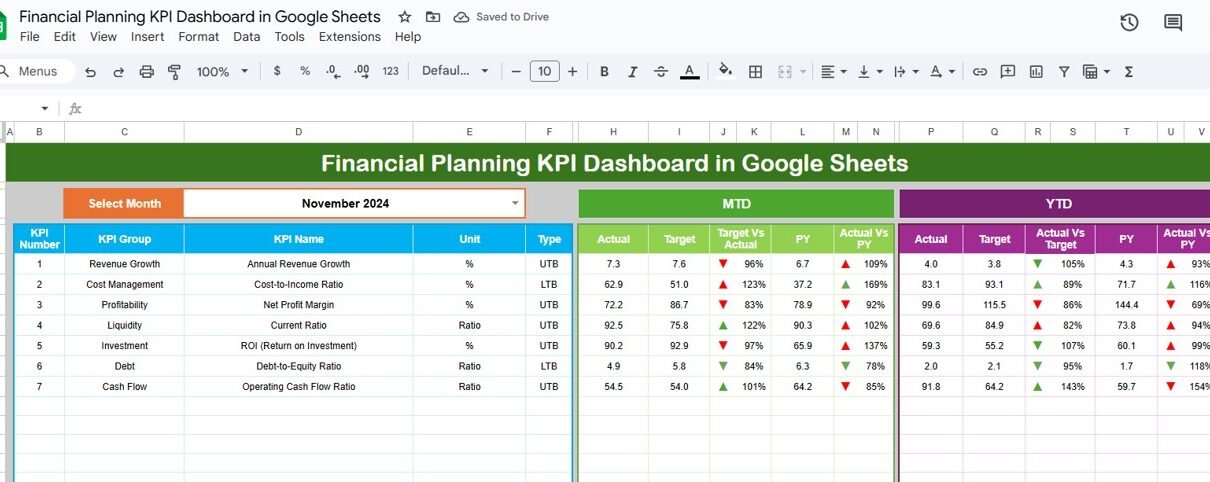
The Dashboard Sheet is the main page where all KPIs are displayed. Users can select a month from the drop-down menu in cell D3, and the dashboard automatically updates to show data for the selected month.
Key Metrics Displayed:
-
MTD Actual, Target, Previous Year Data with conditional formatting arrows for up/down trends
-
YTD Actual, Target, Previous Year Data with conditional formatting arrows
-
Dynamic charts and progress indicators for quick insights
Click to Buy Financial Planning KPI Dashboard in Google Sheets
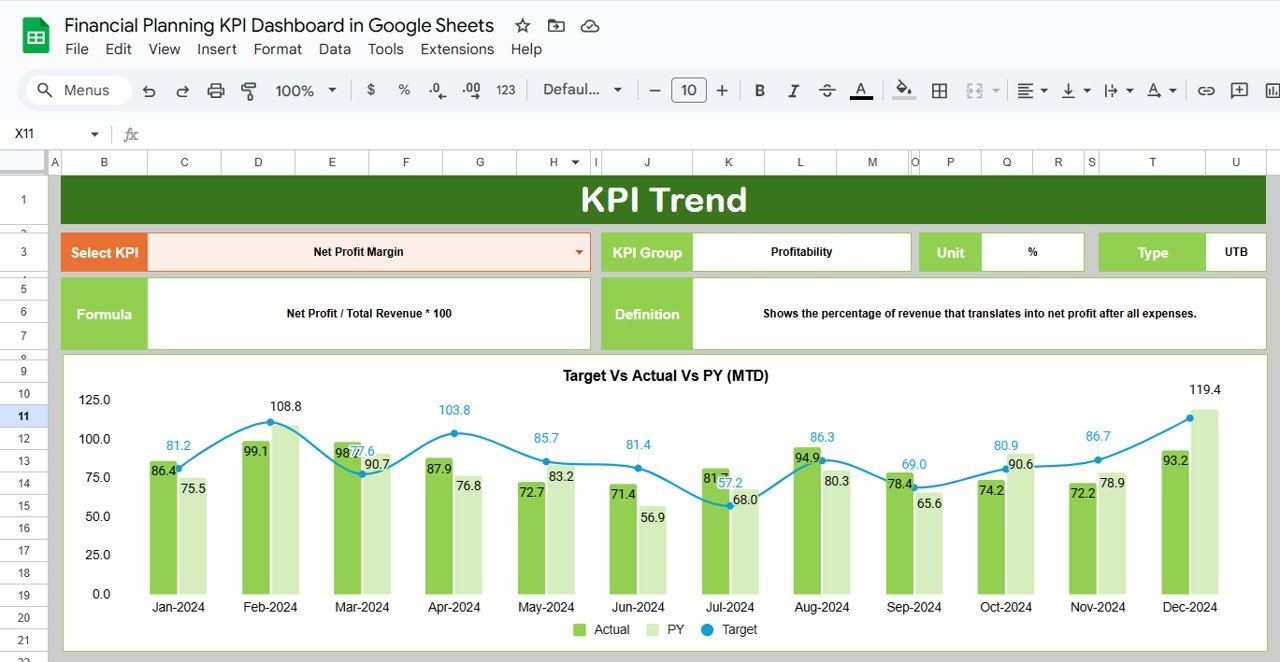
2. KPI Trend Sheet Tab
The KPI Trend Sheet allows you to track each KPI individually. From cell C3, select the KPI to view detailed information.
Details provided for each KPI include:
-
KPI Group
-
Unit of Measure
-
Type of KPI (Lower the Better / Upper the Better)
-
KPI Formula
-
KPI Definition
This helps in understanding the performance trends and identifying areas that need improvement.
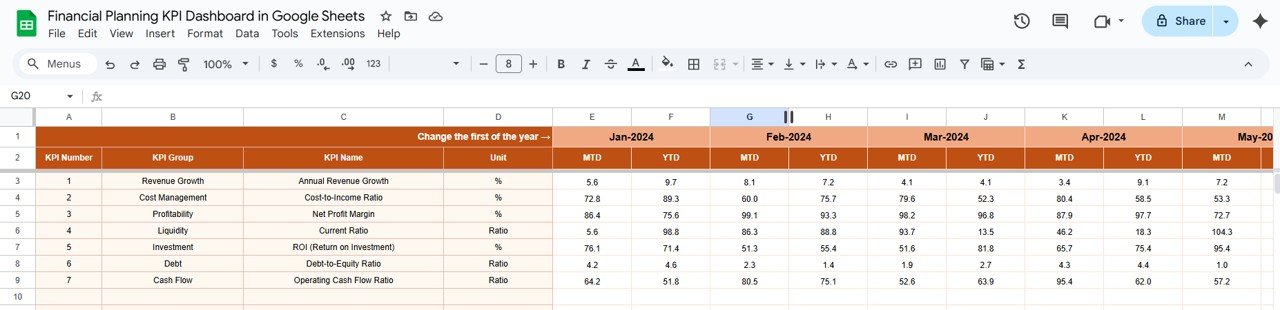
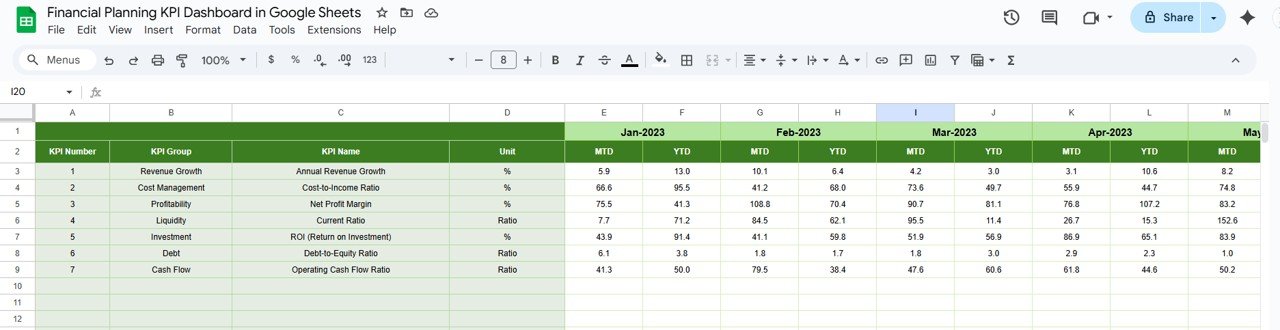
3. Actual Number Sheet Tab
The Actual Numbers Sheet is where you input your MTD and YTD actual numbers. By entering the first month of the year in cell E1, the sheet automatically calculates totals and feeds the dashboard.
This sheet ensures all financial data is up-to-date and reflects real-time performance.
Click to Buy Financial Planning KPI Dashboard in Google Sheets
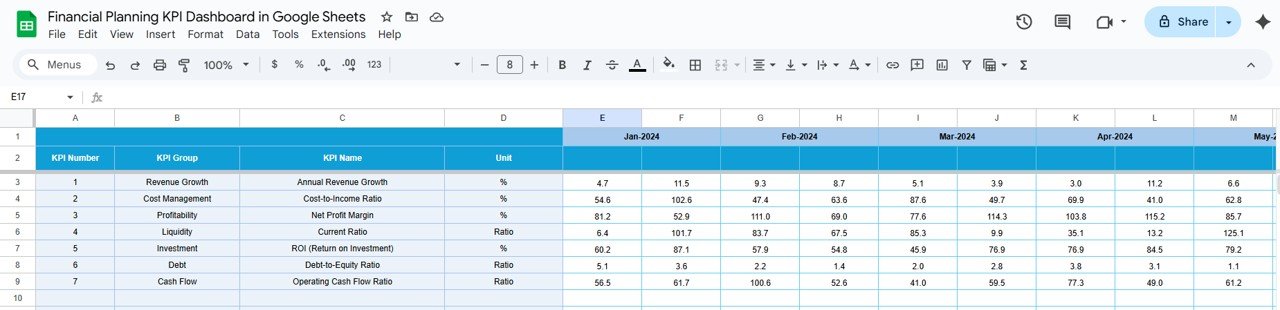
4. Target Sheet Tab
The Target Sheet allows you to input the planned target for each KPI. Targets can be set for both MTD and YTD, giving you a clear benchmark against actual performance.
With this, you can easily identify if your financial goals are being met or if corrective action is needed.
5. Previous Year Numbers Sheet Tab
This sheet captures the previous year’s numbers for the same KPIs. Comparing current performance with historical data allows you to analyze trends and understand growth patterns.
Click to Buy Financial Planning KPI Dashboard in Google Sheets
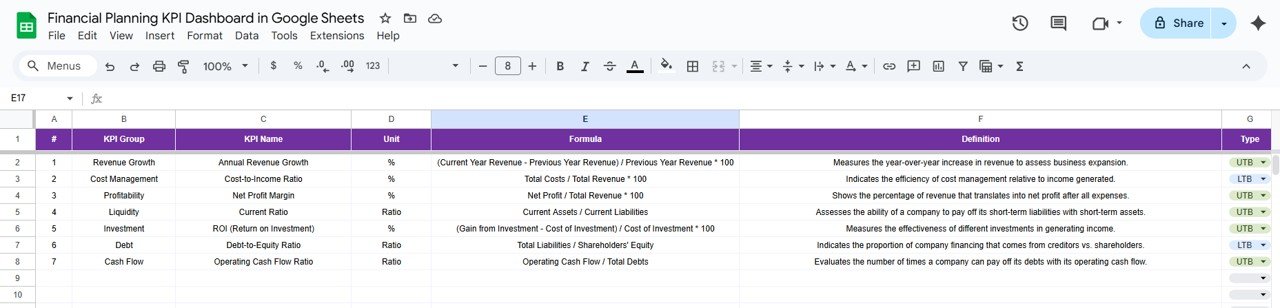
6. KPI Definition Sheet Tab
The KPI Definition Sheet is where you define each KPI in detail:
-
KPI Name
-
KPI Group
-
Unit
-
Formula
-
KPI Definition
This ensures consistency across the dashboard and helps new users understand each metric clearly.
Advantages of Using Financial Planning KPI Dashboard
-
Centralized Data: All financial metrics are consolidated in one sheet for easier monitoring.
-
Real-Time Updates: Monthly selection updates the dashboard instantly.
-
Customizable KPIs: Add or remove KPIs based on your organization’s needs.
-
Trend Analysis: MTD vs YTD and PY vs Actual comparison allows better insights.
-
User-Friendly: No advanced software required; built entirely in Google Sheets.
Opportunities for Improvement
Click to Buy Financial Planning KPI Dashboard in Google Sheets
-
Integration with Accounting Systems: Automate data import from ERP or accounting software.
-
Enhanced Visualizations: Add pivot charts or heatmaps for better visualization.
-
Advanced Formulas: Include scenario analysis or predictive financial metrics.
-
Access Control: Secure sensitive financial data with user-level permissions.
Best Practices for Using the Dashboard
-
Update Data Regularly: Ensure MTD, YTD, and previous year numbers are entered accurately.
-
Set Realistic Targets: Define achievable financial KPIs to monitor performance effectively.
-
Review Trends Monthly: Use conditional formatting arrows to quickly identify areas needing attention.
-
Document Formulas: Keep KPI formulas transparent for auditing and consistency.
Conclusion
Click to Buy Financial Planning KPI Dashboard in Google Sheets
The Financial Planning KPI Dashboard in Google Sheets is a powerful tool for organizations looking to track and manage financial performance efficiently. By consolidating KPIs, targets, and historical data in one sheet, you gain clarity, make informed decisions, and improve financial planning.Financial Planning KPI Dashboard in Google Sheets
Whether you are a finance manager, project lead, or business owner, this dashboard simplifies complex financial monitoring, enhances transparency, and supports strategic decision-making.Financial Planning KPI Dashboard in Google Sheets
FAQs
1. Can I customize the KPIs in the dashboard?
Yes, the dashboard is fully customizable. You can add, remove, or modify KPIs in the KPI Definition Sheet.
2. Does this dashboard calculate MTD and YTD automatically?
Yes, once you input the monthly data, the dashboard calculates MTD and YTD values automatically.
3. Can I compare current performance with the previous year?
Absolutely. The Previous Year Numbers Sheet allows you to perform MTD and YTD comparisons easily.
4. Is this dashboard compatible with Excel?
The current version is built in Google Sheets. It can be converted to Excel, but some formulas and features may need adjustment.
5. Do I need advanced knowledge to use this dashboard?
No. The dashboard is user-friendly and designed for finance professionals with basic Google Sheets knowledge.
Visit our YouTube channel to learn step-by-step video tutorials
Youtube.com/@NeotechNavigators
Watch the step-by-step video Demo:
Click to Buy Financial Planning KPI Dashboard in Google Sheets