The food delivery industry is fast-paced and highly competitive. Efficiently tracking key performance indicators (KPIs) is essential to improve delivery speed, maintain quality, and enhance customer satisfaction. To simplify this process, we have created a Food Delivery KPI Dashboard in Google Sheets — a ready-to-use, interactive dashboard that provides a complete overview of your operations.
What is the Food Delivery KPI Dashboard?
The Food Delivery KPI Dashboard in Google Sheets is a dynamic tool that consolidates all critical KPIs into one centralized platform. It helps delivery managers, operations teams, and business owners monitor performance, compare against targets, and identify areas for improvement.
With this dashboard, you can track metrics like delivery time, order accuracy, customer ratings, and more — all in real-time, with both month-to-date (MTD) and year-to-date (YTD) insights.
Key Features of the Dashboard
The dashboard is organized into six worksheets, each serving a specific purpose:
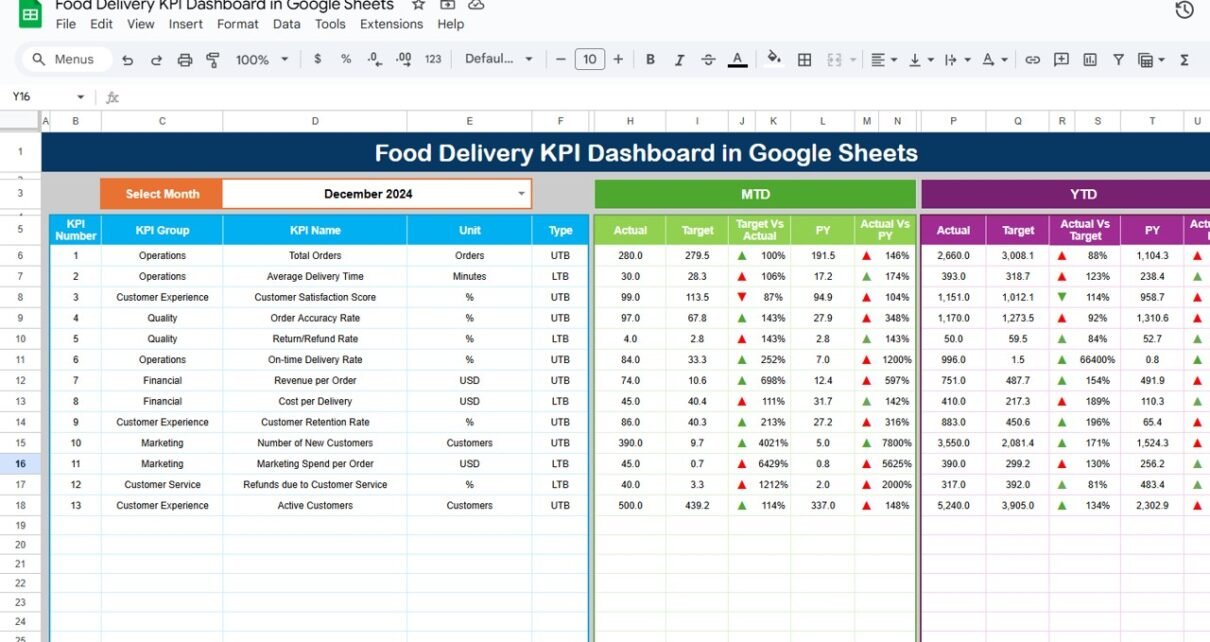
1. Dashboard Sheet Tab
This is the main sheet where all KPI metrics are displayed.
Features Include:
-
Dynamic Month Selection: Use the dropdown in Range D3 to select the month, and the dashboard updates automatically.
-
MTD & YTD Insights: Track actual performance, targets, and previous year’s data.
-
Comparison Metrics: View Target vs Actual and PY vs Actual with conditional formatting using up/down arrows.
This sheet provides a comprehensive overview for quick performance assessment.

Click to Buy Food Delivery KPI Dashboard in Google Sheets
2. KPI Trend Sheet Tab
The KPI Trend sheet provides detailed information for each KPI.
Features Include:
-
Select KPI from dropdown (Range C3)
-
Displays KPI Group, Unit, Type (Lower the Better or Upper the Better)
-
Shows KPI Formula and Definition
-
Helps in understanding KPI calculation logic and performance trends

3. Actual Numbers Sheet Tab
This sheet is where you input actual performance data for MTD and YTD.
Features Include:
-
Enter actual numbers for each month
-
Change the first month of the year in Range E1
-
Supports automatic calculation for monthly and cumulative metrics

Click to Buy Food Delivery KPI Dashboard in Google Sheets
4. Target Sheet Tab
This sheet stores target values for all KPIs.
Features Include:
-
Input monthly targets (MTD and YTD)
-
Aligns performance tracking with your goals
-
Supports comparison with actual numbers in the dashboard

5. Previous Year Numbers Sheet Tab
Here, you can enter KPI data from the previous year for comparison.
Features Include:
-
Maintain historical data for year-on-year analysis
-
Enables quick identification of performance improvements or declines

Click to Buy Food Delivery KPI Dashboard in Google Sheets
6. KPI Definition Sheet Tab
The KPI Definition sheet captures the details of each KPI.
Features Include:
-
KPI Name
-
KPI Group
-
Unit of Measurement
-
Formula for KPI calculation
-
KPI Definition
-
Type: Lower the Better (LTB) or Upper the Better (UTB)
This ensures clarity for all stakeholders and helps maintain standardized KPI calculations.

Click to Buy Food Delivery KPI Dashboard in Google Sheets
Advantages of Using This Dashboard
-
Centralized Performance Tracking: Monitor all food delivery KPIs in one place
-
Dynamic and Interactive: Automatically updates for month selection
-
Historical Comparison: Compare current performance against previous year data
-
Improved Decision Making: Identify bottlenecks, track delivery performance, and optimize operations
-
Clear KPI Definitions: Standardized metrics ensure consistency across the team
Best Practices
Click to Buy Food Delivery KPI Dashboard in Google Sheets
-
Update Data Regularly: Input actual numbers monthly for accurate insights
-
Set Realistic Targets: Ensure KPI targets are achievable yet challenging
-
Analyze Trends: Use KPI trend analysis to identify improvement opportunities
-
Use Visual Indicators: Conditional formatting and trend arrows make data interpretation easier
Conclusion
The Food Delivery KPI Dashboard in Google Sheets is an essential tool for delivery managers and business owners aiming to improve operational efficiency, customer satisfaction, and overall performance. With its dynamic, easy-to-use interface, you can monitor KPIs, compare trends, and make data-driven decisions with confidence.
Visit our YouTube channel to learn step-by-step video tutorials
Youtube.com/@NeotechNavigators
Watch the step-by-step video Demo: