In the competitive world of food service, staying ahead means having real-time insights into how well your business is performing. A Food Service KPI Dashboard is a powerful tool that helps restaurants, cafes, and other food service businesses monitor key performance indicators (KPIs) and optimize their operations. Using Google Sheets to track KPIs allows for easy accessibility, real-time collaboration, and straightforward updates.
This article provides an in-depth look at the Food Service KPI Dashboard in Google Sheets, its key features, and how it helps you stay on top of your food service operations. We will list essential KPIs, provide their definitions, formulas, and units, and specify whether lower is better or upper is better.
What is a Food Service KPI Dashboard?
A Food Service KPI Dashboard is a tool designed to track and visualize key metrics related to the performance of food service businesses. By using a dashboard in Google Sheets, businesses can quickly review their KPIs, identify trends, and make data-driven decisions. This helps food service providers improve efficiency, customer satisfaction, and profitability.
A well-organized dashboard enables stakeholders to assess both short-term and long-term performance, make necessary adjustments, and align their teams with company goals. With the ability to track multiple KPIs, restaurant owners and managers can ensure that every aspect of their operation is performing at its best.
Key Features of the Food Service KPI Dashboard in Google Sheets
Click to buy Food Service KPI Dashboard in Google Sheets
The Food Service KPI Dashboard in Google Sheets comes with six key worksheets that allow for comprehensive performance tracking. Let’s break down these features:
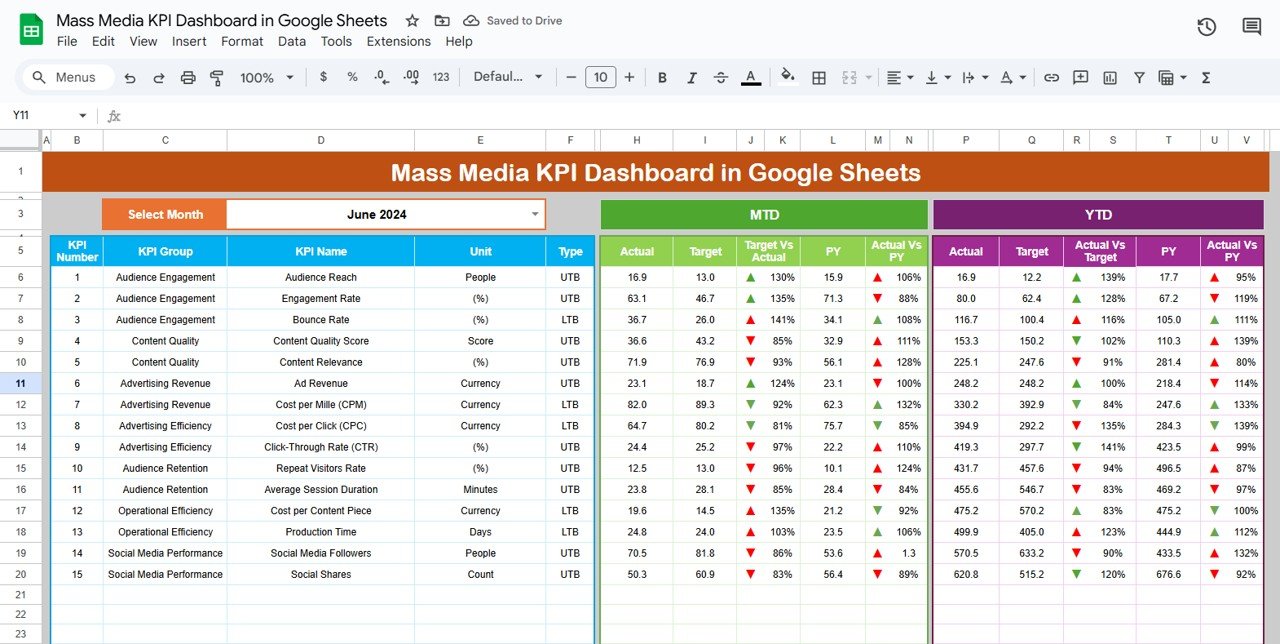
1. Dashboard Sheet Tab
The Dashboard Sheet is the main sheet where all KPIs are presented and tracked. Here, you can:
-
Month Selector: In Range D3, you can select the month from a dropdown list, which will automatically update the dashboard to reflect the selected month.
-
MTD and YTD Data: The dashboard shows Month-to-Date (MTD) and Year-to-Date (YTD) data for each KPI, alongside Target and Previous Year (PY) figures.
-
Performance Visualization: Conditional formatting is used to display up and down arrows, helping to visualize performance trends in a clear, straightforward way.

Click to buy Food Service KPI Dashboard in Google Sheets
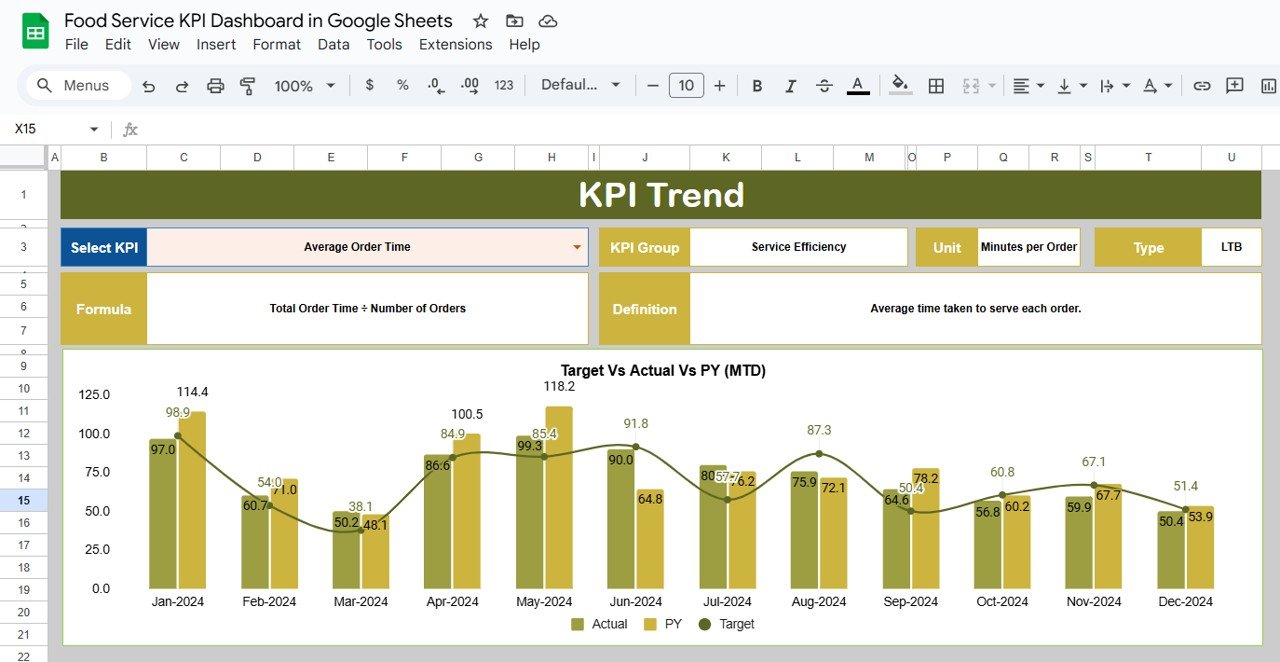
2. KPI Trend Sheet Tab
The KPI Trend Sheet allows you to monitor the performance of each KPI over time:
-
KPI Selection: You can select a specific KPI from the dropdown in Range C3 to view its trend.
-
KPI Details: This sheet provides the KPI group, unit of measurement, formula for calculation, and a definition of the KPI, along with whether the KPI is lower the better or upper the better.
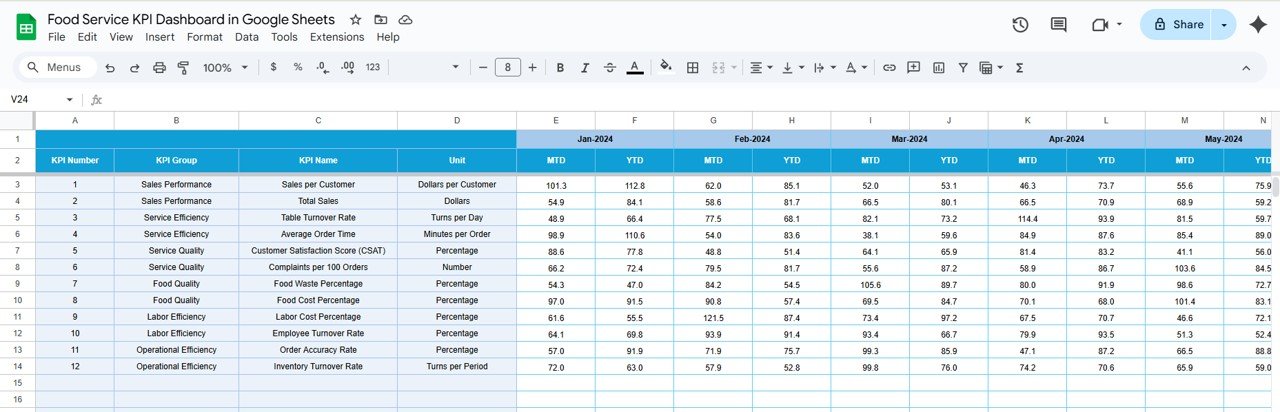
3. Actual Number Sheet Tab
In the Actual Number Sheet, you input the actual performance data for each KPI:
-
YTD and MTD Data: You can enter the actual numbers for both MTD and YTD for a particular month.
-
Month Adjustment: By changing the month in Range E1, all data will be automatically adjusted to reflect the relevant month’s figures.

Click to buy Food Service KPI Dashboard in Google Sheets
4. Target Sheet Tab
The Target Sheet is where you enter the target performance values for each KPI:
-
Monthly and Yearly Targets: For each KPI, you can input both MTD and YTD targets, allowing for better performance tracking against goals.
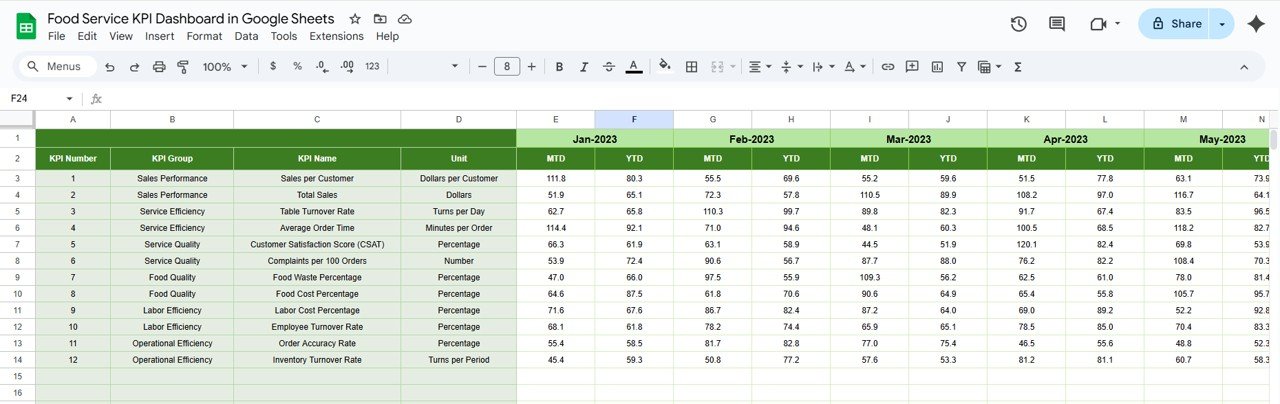
5. Previous Year Number Sheet Tab
This sheet stores data for previous year’s KPIs:
-
Historical Data: Enter the previous year’s data in this sheet to compare it with the current year’s performance. This is useful for year-over-year comparisons and trend analysis.
Click to buy Food Service KPI Dashboard in Google Sheets
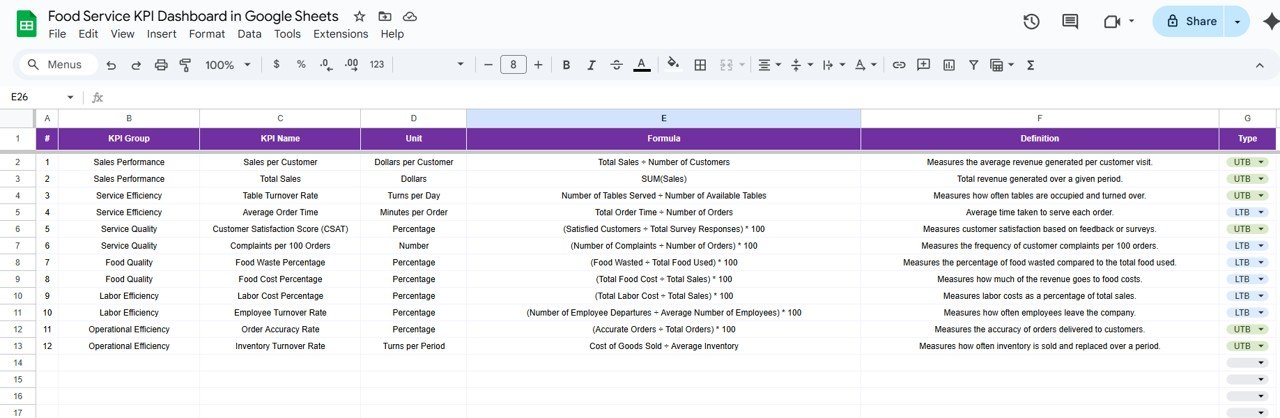
6. KPI Definition Sheet Tab
The KPI Definition Sheet provides a detailed breakdown of each KPI:
-
Name and Group: Each KPI is defined by its name and group (e.g., financial, operational).
-
Formula and Definition: This sheet includes the formula used to calculate each KPI and its definition to ensure clarity and consistency across your team.
Best Practices for Using the Food Service KPI Dashboard
Click to buy Food Service KPI Dashboard in Google Sheets
To maximize the value of your Food Service KPI Dashboard, consider following these best practices:
- Regular Data Updates; Consistently update the dashboard with accurate data. Monthly updates ensure the dashboard remains relevant and reflective of current trends.
- Set Realistic Targets: Set achievable targets based on past performance and industry standards. This will ensure that your KPIs are both challenging and attainable.
- Use Conditional Formatting: Incorporate conditional formatting in Google Sheets to visually indicate whether your KPIs are on track. For example, use green for meeting targets and red for underperformance.
- Review KPIs Regularly: Make it a habit to review the dashboard regularly. This will allow you to catch trends early and make timely adjustments to improve performance.
- Customize the Dashboard: Customize the KPIs based on the specific needs of your food service business. If you operate a cafe, you might track different KPIs compared to a large restaurant chain.
Opportunities for Improvement in Food Service KPI Dashboards
Even the best dashboards can be improved. Here are a few opportunities to enhance your Food Service KPI Dashboard:
- Integrate Real-Time Data: Consider integrating your dashboard with your Point of Sale (POS) system for real-time data tracking. This ensures that your data is always up-to-date, providing the most accurate insights.
- Advanced Analytics: Incorporate predictive analytics into your dashboard to forecast future trends and optimize inventory and staffing.
- Employee Engagement: Use KPIs like employee satisfaction and training completion rate to measure and improve team performance.
Frequently Asked Questions (FAQ)
1. What are the most important KPIs for a food service business?
The most important KPIs include Food Cost Percentage, Labor Cost Percentage, Customer Satisfaction Score (CSAT), and Revenue per Available Seat Hour (RevPASH).
2. Can I integrate this KPI dashboard with my restaurant’s POS system?
Yes, integrating your Food Service KPI Dashboard with your POS system will provide real-time data and make performance tracking even more efficient.
3. How often should I update my food service KPI dashboard?
It’s essential to update your dashboard monthly to ensure that you’re working with the most accurate data available.
4. Can I customize the KPIs for my specific food service business?
Absolutely! You can tailor the dashboard by adding or removing KPIs based on the unique needs of your business.
5. How can I use this dashboard to improve my food service business?
By regularly reviewing your KPIs, setting realistic targets, and taking corrective actions, you can improve operational efficiency, enhance customer satisfaction, and boost profitability.
Conclusion
Click to buy Food Service KPI Dashboard in Google Sheets
A Food Service KPI Dashboard in Google Sheets is an essential tool for food service businesses that want to track performance, identify trends, and make data-driven decisions. By keeping track of key KPIs like Food Cost Percentage, Customer Satisfaction Score, and Revenue per Available Seat Hour, you can improve efficiency and profitability in your food service operations.
Visit our YouTube channel to learn step-by-step video tutorials